

In Magento 2, you can add a chart to an admin grid to display graphical data representation using the Chart Js Library. Here’s a step-by-step guide on how to do this:
Step 1:
Certainly, if you have a custom module named Bluethink_AdvanceReports, you need to include a JavaScript library file named lib-chart.js under the path view/adminhtml/web/js/, you can follow these steps to properly include the JavaScript library in your module:
|
1 2 3 4 5 6 7 8 9 10 11 12 13 14 15 16 17 18 19 20 21 22 23 24 25 26 27 28 29 30 31 32 33 34 35 36 37 38 39 40 41 42 43 44 45 46 47 48 49 50 51 52 53 54 55 56 57 58 59 60 61 62 63 64 65 66 67 68 69 70 71 72 73 74 75 76 77 78 79 80 81 82 83 84 85 86 87 88 89 90 91 92 93 94 95 96 97 98 99 100 101 102 103 104 105 106 107 108 109 110 111 112 113 114 115 116 117 118 119 120 121 122 123 124 125 126 127 128 129 130 131 132 133 134 135 136 137 138 139 140 141 142 143 144 145 146 147 148 149 150 151 152 153 154 155 156 157 158 159 160 161 162 163 164 165 166 167 168 169 170 171 172 173 174 175 176 177 178 179 180 181 182 183 184 185 186 187 188 189 190 191 192 193 194 195 196 197 198 199 200 201 202 203 204 205 206 207 208 209 210 211 212 213 214 215 216 217 218 219 220 221 222 223 224 225 226 227 228 229 230 231 232 233 234 235 236 237 238 239 240 241 242 243 244 245 246 247 248 249 250 251 252 253 254 255 256 257 258 259 260 261 262 263 264 265 266 267 268 269 270 271 272 273 274 275 276 277 278 279 280 281 282 283 284 285 286 287 288 289 290 291 292 293 294 295 296 297 298 299 300 301 302 303 304 305 306 307 308 309 310 311 312 313 314 315 316 317 318 319 320 321 322 323 324 325 326 327 328 329 330 331 332 333 334 335 336 337 338 339 340 341 342 343 344 345 346 347 348 349 350 351 352 353 354 355 356 357 358 359 360 361 362 363 364 365 366 367 368 369 370 371 372 373 374 375 376 377 378 379 380 381 382 383 384 385 386 387 388 389 390 391 392 393 394 395 396 397 398 399 400 401 402 403 404 405 406 407 408 409 410 411 412 413 414 415 416 417 418 419 420 421 422 423 424 425 426 427 428 429 430 431 432 433 434 435 436 437 438 439 440 441 442 443 444 445 446 447 448 449 450 451 452 453 454 455 456 457 458 459 460 461 462 463 464 465 466 467 468 469 470 471 472 473 474 475 476 477 478 479 480 481 482 483 484 485 486 487 488 489 490 491 492 493 494 495 496 497 498 499 500 501 502 503 504 505 506 507 508 509 510 511 512 513 514 515 516 517 518 519 520 521 522 523 524 525 526 527 528 529 530 531 532 533 534 535 536 537 538 539 540 541 542 543 544 545 546 547 548 549 550 551 552 553 554 555 556 557 558 559 560 561 562 563 564 565 566 567 568 569 570 571 572 573 574 575 576 577 578 579 580 581 582 583 584 585 586 587 588 589 590 591 592 593 594 595 596 597 598 599 600 601 602 603 604 605 606 607 608 609 610 611 612 613 614 615 616 617 618 619 620 621 622 623 624 625 626 627 628 629 630 631 632 633 634 635 636 637 638 639 640 641 642 643 644 645 646 647 648 649 650 651 652 653 654 655 656 657 658 659 660 661 662 663 664 665 666 667 668 669 670 671 672 673 674 675 676 677 678 679 680 681 682 683 684 685 686 687 688 689 690 691 692 693 694 695 696 697 698 699 700 701 702 703 704 705 706 707 708 709 710 711 712 713 714 715 716 717 718 719 720 721 722 723 724 725 726 727 728 729 730 731 732 733 734 735 736 737 738 739 740 741 742 743 744 745 746 747 748 749 750 751 752 753 754 755 756 757 758 759 760 761 762 763 764 765 766 767 768 769 770 771 772 773 774 775 776 777 778 779 780 781 782 783 784 785 786 787 788 789 790 791 792 793 794 795 796 797 798 799 800 801 802 803 804 805 806 807 808 809 810 811 812 813 814 815 816 817 818 819 820 821 822 823 824 825 826 827 828 829 830 831 832 833 834 835 836 837 838 839 840 841 842 843 844 845 846 847 848 849 850 851 852 853 854 855 856 857 858 859 860 861 862 863 864 865 866 867 868 869 870 871 872 873 874 875 876 877 878 879 880 881 882 883 884 885 886 887 888 889 890 891 892 893 894 895 896 897 898 899 900 901 902 903 904 905 906 907 908 909 910 911 912 913 914 915 916 917 918 919 920 921 922 923 924 925 926 927 928 929 930 931 932 933 934 935 936 937 938 939 940 941 942 943 944 945 946 947 948 949 950 951 952 953 954 955 956 957 958 959 960 961 962 963 964 965 966 967 968 969 970 971 972 973 974 975 976 977 978 979 980 981 982 983 984 985 986 987 988 989 990 991 992 993 994 995 996 997 998 999 1000 1001 1002 1003 1004 1005 1006 1007 1008 1009 1010 1011 1012 1013 1014 1015 1016 1017 1018 1019 1020 1021 1022 1023 1024 1025 1026 1027 1028 1029 1030 1031 1032 1033 1034 1035 1036 1037 1038 1039 1040 1041 1042 1043 1044 1045 1046 1047 1048 1049 1050 1051 1052 1053 1054 1055 1056 1057 1058 1059 1060 1061 1062 1063 1064 1065 1066 1067 1068 1069 1070 1071 1072 1073 1074 1075 1076 1077 1078 1079 1080 1081 1082 1083 1084 1085 1086 1087 1088 1089 1090 1091 1092 1093 1094 1095 1096 1097 1098 1099 1100 1101 1102 1103 1104 1105 1106 1107 1108 1109 1110 1111 1112 1113 1114 1115 1116 1117 1118 1119 1120 1121 1122 1123 1124 1125 1126 1127 1128 1129 1130 1131 1132 1133 1134 1135 1136 1137 1138 1139 1140 1141 1142 1143 1144 1145 1146 1147 1148 1149 1150 1151 1152 1153 1154 1155 1156 1157 1158 1159 1160 1161 1162 1163 1164 1165 1166 1167 1168 1169 1170 1171 1172 1173 1174 1175 1176 1177 1178 1179 1180 1181 1182 1183 1184 1185 1186 1187 1188 1189 1190 1191 1192 1193 1194 1195 1196 1197 1198 1199 1200 1201 1202 1203 1204 1205 1206 1207 1208 1209 1210 1211 1212 1213 1214 1215 1216 1217 1218 1219 1220 1221 1222 1223 1224 1225 1226 1227 1228 1229 1230 1231 1232 1233 1234 1235 1236 1237 1238 1239 1240 1241 1242 1243 1244 1245 1246 1247 1248 1249 1250 1251 1252 1253 1254 1255 1256 1257 1258 1259 1260 1261 1262 1263 1264 1265 1266 1267 1268 1269 1270 1271 1272 1273 1274 1275 1276 1277 1278 1279 1280 1281 1282 1283 1284 1285 1286 1287 1288 1289 1290 1291 1292 1293 1294 1295 1296 1297 1298 1299 1300 1301 1302 1303 1304 1305 1306 1307 1308 1309 1310 1311 1312 1313 1314 1315 1316 1317 1318 1319 1320 1321 1322 1323 1324 1325 1326 1327 1328 1329 1330 1331 1332 1333 1334 1335 1336 1337 1338 1339 1340 1341 1342 1343 1344 1345 1346 1347 1348 1349 1350 1351 1352 1353 1354 1355 1356 1357 1358 1359 1360 1361 1362 1363 1364 1365 1366 1367 1368 1369 1370 1371 1372 1373 1374 1375 1376 1377 1378 1379 1380 1381 1382 1383 1384 1385 1386 1387 1388 1389 1390 1391 1392 1393 1394 1395 1396 1397 1398 1399 1400 1401 1402 1403 1404 1405 1406 1407 1408 1409 1410 1411 1412 1413 1414 1415 1416 1417 1418 1419 1420 1421 1422 1423 1424 1425 1426 1427 1428 1429 1430 1431 1432 1433 1434 1435 1436 1437 1438 1439 1440 1441 1442 1443 1444 1445 1446 1447 1448 1449 1450 1451 1452 1453 1454 1455 1456 1457 1458 1459 1460 1461 1462 1463 1464 1465 1466 1467 1468 1469 1470 1471 1472 1473 1474 1475 1476 1477 1478 1479 1480 1481 1482 1483 1484 1485 1486 1487 1488 1489 1490 1491 1492 1493 1494 1495 1496 1497 1498 1499 1500 1501 1502 1503 1504 1505 1506 1507 1508 1509 1510 1511 1512 1513 1514 1515 1516 1517 1518 1519 1520 1521 1522 1523 1524 1525 1526 1527 1528 1529 1530 1531 1532 1533 1534 1535 1536 1537 1538 1539 1540 1541 1542 1543 1544 1545 1546 1547 1548 1549 1550 1551 1552 1553 1554 1555 1556 1557 1558 1559 1560 1561 1562 1563 1564 1565 1566 1567 1568 1569 1570 1571 1572 1573 1574 1575 1576 1577 1578 1579 1580 1581 1582 1583 1584 1585 1586 1587 1588 1589 1590 1591 1592 1593 1594 1595 1596 1597 1598 1599 1600 1601 1602 1603 1604 1605 1606 1607 1608 1609 1610 1611 1612 1613 1614 1615 1616 1617 1618 1619 1620 1621 1622 1623 1624 1625 1626 1627 1628 1629 1630 1631 1632 1633 1634 1635 1636 1637 1638 1639 1640 1641 1642 1643 1644 1645 1646 1647 1648 1649 1650 1651 1652 1653 1654 1655 1656 1657 1658 1659 1660 1661 1662 1663 1664 1665 1666 1667 1668 1669 1670 1671 1672 1673 1674 1675 1676 1677 1678 1679 1680 1681 1682 1683 1684 1685 1686 1687 1688 1689 1690 1691 1692 1693 1694 1695 1696 1697 1698 1699 1700 1701 1702 1703 1704 1705 1706 1707 1708 1709 1710 1711 1712 1713 1714 1715 1716 1717 1718 1719 1720 1721 1722 1723 1724 1725 1726 1727 1728 1729 1730 1731 1732 1733 1734 1735 1736 1737 1738 1739 1740 1741 1742 1743 1744 1745 1746 1747 1748 1749 1750 1751 1752 1753 1754 1755 1756 1757 1758 1759 1760 1761 1762 1763 1764 1765 1766 1767 1768 1769 1770 1771 1772 1773 1774 1775 1776 1777 1778 1779 1780 1781 1782 1783 1784 1785 1786 1787 1788 1789 1790 1791 1792 1793 1794 1795 1796 1797 1798 1799 1800 1801 1802 1803 1804 1805 1806 1807 1808 1809 1810 1811 1812 1813 1814 1815 1816 1817 1818 1819 1820 1821 1822 1823 1824 1825 1826 1827 1828 1829 1830 1831 1832 1833 1834 1835 1836 1837 1838 1839 1840 1841 1842 1843 1844 1845 1846 1847 1848 1849 1850 1851 1852 1853 1854 1855 1856 1857 1858 1859 1860 1861 1862 1863 1864 1865 1866 1867 1868 1869 1870 1871 1872 1873 1874 1875 1876 1877 1878 1879 1880 1881 1882 1883 1884 1885 1886 1887 1888 1889 1890 1891 1892 1893 1894 1895 1896 1897 1898 1899 1900 1901 1902 1903 1904 1905 1906 1907 1908 1909 1910 1911 1912 1913 1914 1915 1916 1917 1918 1919 1920 1921 1922 1923 1924 1925 1926 1927 1928 1929 1930 1931 1932 1933 1934 1935 1936 1937 1938 1939 1940 1941 1942 1943 1944 1945 1946 1947 1948 1949 1950 1951 1952 1953 1954 1955 1956 1957 1958 1959 1960 1961 1962 1963 1964 1965 1966 1967 1968 1969 1970 1971 1972 1973 1974 1975 1976 1977 1978 1979 1980 1981 1982 1983 1984 1985 1986 1987 1988 1989 1990 1991 1992 1993 1994 1995 1996 1997 1998 1999 2000 2001 2002 2003 2004 2005 2006 2007 2008 2009 2010 2011 2012 2013 2014 2015 2016 2017 2018 2019 2020 2021 2022 2023 2024 2025 2026 2027 2028 2029 2030 2031 2032 2033 2034 2035 2036 2037 2038 2039 2040 2041 2042 2043 2044 2045 2046 2047 2048 2049 2050 2051 2052 2053 2054 2055 2056 2057 2058 2059 2060 2061 2062 2063 2064 2065 2066 2067 2068 2069 2070 2071 2072 2073 2074 2075 2076 2077 2078 2079 2080 2081 2082 2083 2084 2085 2086 2087 2088 2089 2090 2091 2092 2093 2094 2095 2096 2097 2098 2099 2100 2101 2102 2103 2104 2105 2106 2107 2108 2109 2110 2111 2112 2113 2114 2115 2116 2117 2118 2119 2120 2121 2122 2123 2124 2125 2126 2127 2128 2129 2130 2131 2132 2133 2134 2135 2136 2137 2138 2139 2140 2141 2142 2143 2144 2145 2146 2147 2148 2149 2150 2151 2152 2153 2154 2155 2156 2157 2158 2159 2160 2161 2162 2163 2164 2165 2166 2167 2168 2169 2170 2171 2172 2173 2174 2175 2176 2177 2178 2179 2180 2181 2182 2183 2184 2185 2186 2187 2188 2189 2190 2191 2192 2193 2194 2195 2196 2197 2198 2199 2200 2201 2202 2203 2204 2205 2206 2207 2208 2209 2210 2211 2212 2213 2214 2215 2216 2217 2218 2219 2220 2221 2222 2223 2224 2225 2226 2227 2228 2229 2230 2231 2232 2233 2234 2235 2236 2237 2238 2239 2240 2241 2242 2243 2244 2245 2246 2247 2248 2249 2250 2251 2252 2253 2254 2255 2256 2257 2258 2259 2260 2261 2262 2263 2264 2265 2266 2267 2268 2269 2270 2271 2272 2273 2274 2275 2276 2277 2278 2279 2280 2281 2282 2283 2284 2285 2286 2287 2288 2289 2290 2291 2292 2293 2294 2295 2296 2297 2298 2299 2300 2301 2302 2303 2304 2305 2306 2307 2308 2309 2310 2311 2312 2313 2314 2315 2316 2317 2318 2319 2320 2321 2322 2323 2324 2325 2326 2327 2328 2329 2330 2331 2332 2333 2334 2335 2336 2337 2338 2339 2340 2341 2342 2343 2344 2345 2346 2347 2348 2349 2350 2351 2352 2353 2354 2355 2356 2357 2358 2359 2360 2361 2362 2363 2364 2365 2366 2367 2368 2369 2370 2371 2372 2373 2374 2375 2376 2377 2378 2379 2380 2381 2382 2383 2384 2385 2386 2387 2388 2389 2390 2391 2392 2393 2394 2395 2396 2397 2398 2399 2400 2401 2402 2403 2404 2405 2406 2407 2408 2409 2410 2411 2412 2413 2414 2415 2416 2417 2418 2419 2420 2421 2422 2423 2424 2425 2426 2427 2428 2429 2430 2431 2432 2433 2434 2435 2436 2437 2438 2439 2440 2441 2442 2443 2444 2445 2446 2447 2448 2449 2450 2451 2452 2453 2454 2455 2456 2457 2458 2459 2460 2461 2462 2463 2464 2465 2466 2467 2468 2469 2470 2471 2472 2473 2474 2475 2476 2477 2478 2479 2480 2481 2482 2483 2484 2485 2486 2487 2488 2489 2490 2491 2492 2493 2494 2495 2496 2497 2498 2499 2500 2501 2502 2503 2504 2505 2506 2507 2508 2509 2510 2511 2512 2513 2514 2515 2516 2517 2518 2519 2520 2521 2522 2523 2524 2525 2526 2527 2528 2529 2530 2531 2532 2533 2534 2535 2536 2537 2538 2539 2540 2541 2542 2543 2544 2545 2546 2547 2548 2549 2550 2551 2552 2553 2554 2555 2556 2557 2558 2559 2560 2561 2562 2563 2564 2565 2566 2567 2568 2569 2570 2571 2572 2573 2574 2575 2576 2577 2578 2579 2580 2581 2582 2583 2584 2585 2586 2587 2588 2589 2590 2591 2592 2593 2594 2595 2596 2597 2598 2599 2600 2601 2602 2603 2604 2605 2606 2607 2608 2609 2610 2611 2612 2613 2614 2615 2616 2617 2618 2619 2620 2621 2622 2623 2624 2625 2626 2627 2628 2629 2630 2631 2632 2633 2634 2635 2636 2637 2638 2639 2640 2641 2642 2643 2644 2645 2646 2647 2648 2649 2650 2651 2652 2653 2654 2655 2656 2657 2658 2659 2660 2661 2662 2663 2664 2665 2666 2667 2668 2669 2670 2671 2672 2673 2674 2675 2676 2677 2678 2679 2680 2681 2682 2683 2684 2685 2686 2687 2688 2689 2690 2691 2692 2693 2694 2695 2696 2697 2698 2699 2700 2701 2702 2703 2704 2705 2706 2707 2708 2709 2710 2711 2712 2713 2714 2715 2716 2717 2718 2719 2720 2721 2722 2723 2724 2725 2726 2727 2728 2729 2730 2731 2732 2733 2734 2735 2736 2737 2738 2739 2740 2741 2742 2743 2744 2745 2746 2747 2748 2749 2750 2751 2752 2753 2754 2755 2756 2757 2758 2759 2760 2761 2762 2763 2764 2765 2766 2767 2768 2769 2770 2771 2772 2773 2774 2775 2776 2777 2778 2779 2780 2781 2782 2783 2784 2785 2786 2787 2788 2789 2790 2791 2792 2793 2794 2795 2796 2797 2798 2799 2800 2801 2802 2803 2804 2805 2806 2807 2808 2809 2810 2811 2812 2813 2814 2815 2816 2817 2818 2819 2820 2821 2822 2823 2824 2825 2826 2827 2828 2829 2830 2831 2832 2833 2834 2835 2836 2837 2838 2839 2840 2841 2842 2843 2844 2845 2846 2847 2848 2849 2850 2851 2852 2853 2854 2855 2856 2857 2858 2859 2860 2861 2862 2863 2864 2865 2866 2867 2868 2869 2870 2871 2872 2873 2874 2875 2876 2877 2878 2879 2880 2881 2882 2883 2884 2885 2886 2887 2888 2889 2890 2891 2892 2893 2894 2895 2896 2897 2898 2899 2900 2901 2902 2903 2904 2905 2906 2907 2908 2909 2910 2911 2912 2913 2914 2915 2916 2917 2918 2919 2920 2921 2922 2923 2924 2925 2926 2927 2928 2929 2930 2931 2932 2933 2934 2935 2936 2937 2938 2939 2940 2941 2942 2943 2944 2945 2946 2947 2948 2949 2950 2951 2952 2953 2954 2955 2956 2957 2958 2959 2960 2961 2962 2963 2964 2965 2966 2967 2968 2969 2970 2971 2972 2973 2974 2975 2976 2977 2978 2979 2980 2981 2982 2983 2984 2985 2986 2987 2988 2989 2990 2991 2992 2993 2994 2995 2996 2997 2998 2999 3000 3001 3002 3003 3004 3005 3006 3007 3008 3009 3010 3011 3012 3013 3014 3015 3016 3017 3018 3019 3020 3021 3022 3023 3024 3025 3026 3027 3028 3029 3030 3031 3032 3033 3034 3035 3036 3037 3038 3039 3040 3041 3042 3043 3044 3045 3046 3047 3048 3049 3050 3051 3052 3053 3054 3055 3056 3057 3058 3059 3060 3061 3062 3063 3064 3065 3066 3067 3068 3069 3070 3071 3072 3073 3074 3075 3076 3077 3078 3079 3080 3081 3082 3083 3084 3085 3086 3087 3088 3089 3090 3091 3092 3093 3094 3095 3096 3097 3098 3099 3100 3101 3102 3103 3104 3105 3106 3107 3108 3109 3110 3111 3112 3113 3114 3115 3116 3117 3118 3119 3120 3121 3122 3123 3124 3125 3126 3127 3128 3129 3130 3131 3132 3133 3134 3135 3136 3137 3138 3139 3140 3141 3142 3143 3144 3145 3146 3147 3148 3149 3150 3151 3152 3153 3154 3155 3156 3157 3158 3159 3160 3161 3162 3163 3164 3165 3166 3167 3168 3169 3170 3171 3172 3173 3174 3175 3176 3177 3178 3179 3180 3181 3182 3183 3184 3185 3186 3187 3188 3189 3190 3191 3192 3193 3194 3195 3196 3197 3198 3199 3200 3201 3202 3203 3204 3205 3206 3207 3208 3209 3210 3211 3212 3213 3214 3215 3216 3217 3218 3219 3220 3221 3222 3223 3224 3225 3226 3227 3228 3229 3230 3231 3232 3233 3234 3235 3236 3237 3238 3239 3240 3241 3242 3243 3244 3245 3246 3247 3248 3249 3250 3251 3252 3253 3254 3255 3256 3257 3258 3259 3260 3261 3262 3263 3264 3265 3266 3267 3268 3269 3270 3271 3272 3273 3274 3275 3276 3277 3278 3279 3280 3281 3282 3283 3284 3285 3286 3287 3288 3289 3290 3291 3292 3293 3294 3295 3296 3297 3298 3299 3300 3301 3302 3303 3304 3305 3306 3307 3308 3309 3310 3311 3312 3313 3314 3315 3316 3317 3318 3319 3320 3321 3322 3323 3324 3325 3326 3327 3328 3329 3330 3331 3332 3333 3334 3335 3336 3337 3338 3339 3340 3341 3342 3343 3344 3345 3346 3347 3348 3349 3350 3351 3352 3353 3354 3355 3356 3357 3358 3359 3360 3361 3362 3363 3364 3365 3366 3367 3368 3369 3370 3371 3372 3373 3374 3375 3376 3377 3378 3379 3380 3381 3382 3383 3384 3385 3386 3387 3388 3389 3390 3391 3392 3393 3394 3395 3396 3397 3398 3399 3400 3401 3402 3403 3404 3405 3406 3407 3408 3409 3410 3411 3412 3413 3414 3415 3416 3417 3418 3419 3420 3421 3422 3423 3424 3425 3426 3427 3428 3429 3430 3431 3432 3433 3434 3435 3436 3437 3438 3439 3440 3441 3442 3443 3444 3445 3446 3447 3448 3449 3450 3451 3452 3453 3454 3455 3456 3457 3458 3459 3460 3461 3462 3463 3464 3465 3466 3467 3468 3469 3470 3471 3472 3473 3474 3475 3476 3477 3478 3479 3480 3481 3482 3483 3484 3485 3486 3487 3488 3489 3490 3491 3492 3493 3494 3495 3496 3497 3498 3499 3500 3501 3502 3503 3504 3505 3506 3507 3508 3509 3510 3511 3512 3513 3514 3515 3516 3517 3518 3519 3520 3521 3522 3523 3524 3525 3526 3527 3528 3529 3530 3531 3532 3533 3534 3535 3536 3537 3538 3539 3540 3541 3542 3543 3544 3545 3546 3547 3548 3549 3550 3551 3552 3553 3554 3555 3556 3557 3558 3559 3560 3561 3562 3563 3564 3565 3566 3567 3568 3569 3570 3571 3572 3573 3574 3575 3576 3577 3578 3579 3580 3581 3582 3583 3584 3585 3586 3587 3588 3589 3590 3591 3592 3593 3594 3595 3596 3597 3598 3599 3600 3601 3602 3603 3604 3605 3606 3607 3608 3609 3610 3611 3612 3613 3614 3615 3616 3617 3618 3619 3620 3621 3622 3623 3624 3625 3626 3627 3628 3629 3630 3631 3632 3633 3634 3635 3636 3637 3638 3639 3640 3641 3642 3643 3644 3645 3646 3647 3648 3649 3650 3651 3652 3653 3654 3655 3656 3657 3658 3659 3660 3661 3662 3663 3664 3665 3666 3667 3668 3669 3670 3671 3672 3673 3674 3675 3676 3677 3678 3679 3680 3681 3682 3683 3684 3685 3686 3687 3688 3689 3690 3691 3692 3693 3694 3695 3696 3697 3698 3699 3700 3701 3702 3703 3704 3705 3706 3707 3708 3709 3710 3711 3712 3713 3714 3715 3716 3717 3718 3719 3720 3721 3722 3723 3724 3725 3726 3727 3728 3729 3730 3731 3732 3733 3734 3735 3736 3737 3738 3739 3740 3741 3742 3743 3744 3745 3746 3747 3748 3749 3750 3751 3752 3753 3754 3755 3756 3757 3758 3759 3760 3761 3762 3763 3764 3765 3766 3767 3768 3769 3770 3771 3772 3773 3774 3775 3776 3777 3778 3779 3780 3781 3782 3783 3784 3785 3786 3787 3788 3789 3790 3791 3792 3793 3794 3795 3796 3797 3798 3799 3800 3801 3802 3803 3804 3805 3806 3807 3808 3809 3810 3811 3812 3813 3814 3815 3816 3817 3818 3819 3820 3821 3822 3823 3824 3825 3826 3827 3828 3829 3830 3831 3832 3833 3834 3835 3836 3837 3838 3839 3840 3841 3842 3843 3844 3845 3846 3847 3848 3849 3850 3851 3852 3853 3854 3855 3856 3857 3858 3859 3860 3861 3862 3863 3864 3865 3866 3867 3868 3869 3870 3871 3872 3873 3874 3875 3876 3877 3878 3879 3880 3881 3882 3883 3884 3885 3886 3887 3888 3889 3890 3891 3892 3893 3894 3895 3896 3897 3898 3899 3900 3901 3902 3903 3904 3905 3906 3907 3908 3909 3910 3911 3912 3913 3914 3915 3916 3917 3918 3919 3920 3921 3922 3923 3924 3925 3926 3927 3928 3929 3930 3931 3932 3933 3934 3935 3936 3937 3938 3939 3940 3941 3942 3943 3944 3945 3946 3947 3948 3949 3950 3951 3952 3953 3954 3955 3956 3957 3958 3959 3960 3961 3962 3963 3964 3965 3966 3967 3968 3969 3970 3971 3972 3973 3974 3975 3976 3977 3978 3979 3980 3981 3982 3983 3984 3985 3986 3987 3988 3989 3990 3991 3992 3993 3994 3995 3996 3997 3998 3999 4000 4001 4002 4003 4004 4005 4006 4007 4008 4009 4010 4011 4012 4013 4014 4015 4016 4017 4018 4019 4020 4021 4022 4023 4024 4025 4026 4027 4028 4029 4030 4031 4032 4033 4034 4035 4036 4037 4038 4039 4040 4041 4042 4043 4044 4045 4046 4047 4048 4049 4050 4051 4052 4053 4054 4055 4056 4057 4058 4059 4060 4061 4062 4063 4064 4065 4066 4067 4068 4069 4070 4071 4072 4073 4074 4075 4076 4077 4078 4079 4080 4081 4082 4083 4084 4085 4086 4087 4088 4089 4090 4091 4092 4093 4094 4095 4096 4097 4098 4099 4100 4101 4102 4103 4104 4105 4106 4107 4108 4109 4110 4111 4112 4113 4114 4115 4116 4117 4118 4119 4120 4121 4122 4123 4124 4125 4126 4127 4128 4129 4130 4131 4132 4133 4134 4135 4136 4137 4138 4139 4140 4141 4142 4143 4144 4145 4146 4147 4148 4149 4150 4151 4152 4153 4154 4155 4156 4157 4158 4159 4160 4161 4162 4163 4164 4165 4166 4167 4168 4169 4170 4171 4172 4173 4174 4175 4176 4177 4178 4179 4180 4181 4182 4183 4184 4185 4186 4187 4188 4189 4190 4191 4192 4193 4194 4195 4196 4197 4198 4199 4200 4201 4202 4203 4204 4205 4206 4207 4208 4209 4210 4211 4212 4213 4214 4215 4216 4217 4218 4219 4220 4221 4222 4223 4224 4225 4226 4227 4228 4229 4230 4231 4232 4233 4234 4235 4236 4237 4238 4239 4240 4241 4242 4243 4244 4245 4246 4247 4248 4249 4250 4251 4252 4253 4254 4255 4256 4257 4258 4259 4260 4261 4262 4263 4264 4265 4266 4267 4268 4269 4270 4271 4272 4273 4274 4275 4276 4277 4278 4279 4280 4281 4282 4283 4284 4285 4286 4287 4288 4289 4290 4291 4292 4293 4294 4295 4296 4297 4298 4299 4300 4301 4302 4303 4304 4305 4306 4307 4308 4309 4310 4311 4312 4313 4314 4315 4316 4317 4318 4319 4320 4321 4322 4323 4324 4325 4326 4327 4328 4329 4330 4331 4332 4333 4334 4335 4336 4337 4338 4339 4340 4341 4342 4343 4344 4345 4346 4347 4348 4349 4350 4351 4352 4353 4354 4355 4356 4357 4358 4359 4360 4361 4362 4363 4364 4365 4366 4367 4368 4369 4370 4371 4372 4373 4374 4375 4376 4377 4378 4379 4380 4381 4382 4383 4384 4385 4386 4387 4388 4389 4390 4391 4392 4393 4394 4395 4396 4397 4398 4399 4400 4401 4402 4403 4404 4405 4406 4407 4408 4409 4410 4411 4412 4413 4414 4415 4416 4417 4418 4419 4420 4421 4422 4423 4424 4425 4426 4427 4428 4429 4430 4431 4432 4433 4434 4435 4436 4437 4438 4439 4440 4441 4442 4443 4444 4445 4446 4447 4448 4449 4450 4451 4452 4453 4454 4455 4456 4457 4458 4459 4460 4461 4462 4463 4464 4465 4466 4467 4468 4469 4470 4471 4472 4473 4474 4475 4476 4477 4478 4479 4480 4481 4482 4483 4484 4485 4486 4487 4488 4489 4490 4491 4492 4493 4494 4495 4496 4497 4498 4499 4500 4501 4502 4503 4504 4505 4506 4507 4508 4509 4510 4511 4512 4513 4514 4515 4516 4517 4518 4519 4520 4521 4522 4523 4524 4525 4526 4527 4528 4529 4530 4531 4532 4533 4534 4535 4536 4537 4538 4539 4540 4541 4542 4543 4544 4545 4546 4547 4548 4549 4550 4551 4552 4553 4554 4555 4556 4557 4558 4559 4560 4561 4562 4563 4564 4565 4566 4567 4568 4569 4570 4571 4572 4573 4574 4575 4576 4577 4578 4579 4580 4581 4582 4583 4584 4585 4586 4587 4588 4589 4590 4591 4592 4593 4594 4595 4596 4597 4598 4599 4600 4601 4602 4603 4604 4605 4606 4607 4608 4609 4610 4611 4612 4613 4614 4615 4616 4617 4618 4619 4620 4621 4622 4623 4624 4625 4626 4627 4628 4629 4630 4631 4632 4633 4634 4635 4636 4637 4638 4639 4640 4641 4642 4643 4644 4645 4646 4647 4648 4649 4650 4651 4652 4653 4654 4655 4656 4657 4658 4659 4660 4661 4662 4663 4664 4665 4666 4667 4668 4669 4670 4671 4672 4673 4674 4675 4676 4677 4678 4679 4680 4681 4682 4683 4684 4685 4686 4687 4688 4689 4690 4691 4692 4693 4694 4695 4696 4697 4698 4699 4700 4701 4702 4703 4704 4705 4706 4707 4708 4709 4710 4711 4712 4713 4714 4715 4716 4717 4718 4719 4720 4721 4722 4723 4724 4725 4726 4727 4728 4729 4730 4731 4732 4733 4734 4735 4736 4737 4738 4739 4740 4741 4742 4743 4744 4745 4746 4747 4748 4749 4750 4751 4752 4753 4754 4755 4756 4757 4758 4759 4760 4761 4762 4763 4764 4765 4766 4767 4768 4769 4770 4771 4772 4773 4774 4775 4776 4777 4778 4779 4780 4781 4782 4783 4784 4785 4786 4787 4788 4789 4790 4791 4792 4793 4794 4795 4796 4797 4798 4799 4800 4801 4802 4803 4804 4805 4806 4807 4808 4809 4810 4811 4812 4813 4814 4815 4816 4817 4818 4819 4820 4821 4822 4823 4824 4825 4826 4827 4828 4829 4830 4831 4832 4833 4834 4835 4836 4837 4838 4839 4840 4841 4842 4843 4844 4845 4846 4847 4848 4849 4850 4851 4852 4853 4854 4855 4856 4857 4858 4859 4860 4861 4862 4863 4864 4865 4866 4867 4868 4869 4870 4871 4872 4873 4874 4875 4876 4877 4878 4879 4880 4881 4882 4883 4884 4885 4886 4887 4888 4889 4890 4891 4892 4893 4894 4895 4896 4897 4898 4899 4900 4901 4902 4903 4904 4905 4906 4907 4908 4909 4910 4911 4912 4913 4914 4915 4916 4917 4918 4919 4920 4921 4922 4923 4924 4925 4926 4927 4928 4929 4930 4931 4932 4933 4934 4935 4936 4937 4938 4939 4940 4941 4942 4943 4944 4945 4946 4947 4948 4949 4950 4951 4952 4953 4954 4955 4956 4957 4958 4959 4960 4961 4962 4963 4964 4965 4966 4967 4968 4969 4970 4971 4972 4973 4974 4975 4976 4977 4978 4979 4980 4981 4982 4983 4984 4985 4986 4987 4988 4989 4990 4991 4992 4993 4994 4995 4996 4997 4998 4999 5000 5001 5002 5003 5004 5005 5006 5007 5008 5009 5010 5011 5012 5013 5014 5015 5016 5017 5018 5019 5020 5021 5022 5023 5024 5025 5026 5027 5028 5029 5030 5031 5032 5033 5034 5035 5036 5037 5038 5039 5040 5041 5042 5043 5044 5045 5046 5047 5048 5049 5050 5051 5052 5053 5054 5055 5056 5057 5058 5059 5060 5061 5062 5063 5064 5065 5066 5067 5068 5069 5070 5071 5072 5073 5074 5075 5076 5077 5078 5079 5080 5081 5082 5083 5084 5085 5086 5087 5088 5089 5090 5091 5092 5093 5094 5095 5096 5097 5098 5099 5100 5101 5102 5103 5104 5105 5106 5107 5108 5109 5110 5111 5112 5113 5114 5115 5116 5117 5118 5119 5120 5121 5122 5123 5124 5125 5126 5127 5128 5129 5130 5131 5132 5133 5134 5135 5136 5137 5138 5139 5140 5141 5142 5143 5144 5145 5146 5147 5148 5149 5150 5151 5152 5153 5154 5155 5156 5157 5158 5159 5160 5161 5162 5163 5164 5165 5166 5167 5168 5169 5170 5171 5172 5173 5174 5175 5176 5177 5178 5179 5180 5181 5182 5183 5184 5185 5186 5187 5188 5189 5190 5191 5192 5193 5194 5195 5196 5197 5198 5199 5200 5201 5202 5203 5204 5205 5206 5207 5208 5209 5210 5211 5212 5213 5214 5215 5216 5217 5218 5219 5220 5221 5222 5223 5224 5225 5226 5227 5228 5229 5230 5231 5232 5233 5234 5235 5236 5237 5238 5239 5240 5241 5242 5243 5244 5245 5246 5247 5248 5249 5250 5251 5252 5253 5254 5255 5256 5257 5258 5259 5260 5261 5262 5263 5264 5265 5266 5267 5268 5269 5270 5271 5272 5273 5274 5275 5276 5277 5278 5279 5280 5281 5282 5283 5284 5285 5286 5287 5288 5289 5290 5291 5292 5293 5294 5295 5296 5297 5298 5299 5300 5301 5302 5303 5304 5305 5306 5307 5308 5309 5310 5311 5312 5313 5314 5315 5316 5317 5318 5319 5320 5321 5322 5323 5324 5325 5326 5327 5328 5329 5330 5331 5332 5333 5334 5335 5336 5337 5338 5339 5340 5341 5342 5343 5344 5345 5346 5347 5348 5349 5350 5351 5352 5353 5354 5355 5356 5357 5358 5359 5360 5361 5362 5363 5364 5365 5366 5367 5368 5369 5370 5371 5372 5373 5374 5375 5376 5377 5378 5379 5380 5381 5382 5383 5384 5385 5386 5387 5388 5389 5390 5391 5392 5393 5394 5395 5396 5397 5398 5399 5400 5401 5402 5403 5404 5405 5406 5407 5408 5409 5410 5411 5412 5413 5414 5415 5416 5417 5418 5419 5420 5421 5422 5423 5424 5425 5426 5427 5428 5429 5430 5431 5432 5433 5434 5435 5436 5437 5438 5439 5440 5441 5442 5443 5444 5445 5446 5447 5448 5449 5450 5451 5452 5453 5454 5455 5456 5457 5458 5459 5460 5461 5462 5463 5464 5465 5466 5467 5468 5469 5470 5471 5472 5473 5474 5475 5476 5477 5478 5479 5480 5481 5482 5483 5484 5485 5486 5487 5488 5489 5490 5491 5492 5493 5494 5495 5496 5497 5498 5499 5500 5501 5502 5503 5504 5505 5506 5507 5508 5509 5510 5511 5512 5513 5514 5515 5516 5517 5518 5519 5520 5521 5522 5523 5524 5525 5526 5527 5528 5529 5530 5531 5532 5533 5534 5535 5536 5537 5538 5539 5540 5541 5542 5543 5544 5545 5546 5547 5548 5549 5550 5551 5552 5553 5554 5555 5556 5557 5558 5559 5560 5561 5562 5563 5564 5565 5566 5567 5568 5569 5570 5571 5572 5573 5574 5575 5576 5577 5578 5579 5580 5581 5582 5583 5584 5585 5586 5587 5588 5589 5590 5591 5592 5593 5594 5595 5596 5597 5598 5599 5600 5601 5602 5603 5604 5605 5606 5607 5608 5609 5610 5611 5612 5613 5614 5615 5616 5617 5618 5619 5620 5621 5622 5623 5624 5625 5626 5627 5628 5629 5630 5631 5632 5633 5634 5635 5636 5637 5638 5639 5640 5641 5642 5643 5644 5645 5646 5647 5648 5649 5650 5651 5652 5653 5654 5655 5656 5657 5658 5659 5660 5661 5662 5663 5664 5665 5666 5667 5668 5669 5670 5671 5672 5673 5674 5675 5676 5677 5678 5679 5680 5681 5682 5683 5684 5685 5686 5687 5688 5689 5690 5691 5692 5693 5694 5695 5696 5697 5698 5699 5700 5701 5702 5703 5704 5705 5706 5707 5708 5709 5710 5711 5712 5713 5714 5715 5716 5717 5718 5719 5720 5721 5722 5723 5724 5725 5726 5727 5728 5729 5730 5731 5732 5733 5734 5735 5736 5737 5738 5739 5740 5741 5742 5743 5744 5745 5746 5747 5748 5749 5750 5751 5752 5753 5754 5755 5756 5757 5758 5759 5760 5761 5762 5763 5764 5765 5766 5767 5768 5769 5770 5771 5772 5773 5774 5775 5776 5777 5778 5779 5780 5781 5782 5783 5784 5785 5786 5787 5788 5789 5790 5791 5792 5793 5794 5795 5796 5797 5798 5799 5800 5801 5802 5803 5804 5805 5806 5807 5808 5809 5810 5811 5812 5813 5814 5815 5816 5817 5818 5819 5820 5821 5822 5823 5824 5825 5826 5827 5828 5829 5830 5831 5832 5833 5834 5835 5836 5837 5838 5839 5840 5841 5842 5843 5844 5845 5846 5847 5848 5849 5850 5851 5852 5853 5854 5855 5856 5857 5858 5859 5860 5861 5862 5863 5864 5865 5866 5867 5868 5869 5870 5871 5872 5873 5874 5875 5876 5877 5878 5879 5880 5881 5882 5883 5884 5885 5886 5887 5888 5889 5890 5891 5892 5893 5894 5895 5896 5897 5898 5899 5900 5901 5902 5903 5904 5905 5906 5907 5908 5909 5910 5911 5912 5913 5914 5915 5916 5917 5918 5919 5920 5921 5922 5923 5924 5925 5926 5927 5928 5929 5930 5931 5932 5933 5934 5935 5936 5937 5938 5939 5940 5941 5942 5943 5944 5945 5946 5947 5948 5949 5950 5951 5952 5953 5954 5955 5956 5957 5958 5959 5960 5961 5962 5963 5964 5965 5966 5967 5968 5969 5970 5971 5972 5973 5974 5975 5976 5977 5978 5979 5980 5981 5982 5983 5984 5985 5986 5987 5988 5989 5990 5991 5992 5993 5994 5995 5996 5997 5998 5999 6000 6001 6002 6003 6004 6005 6006 6007 6008 6009 6010 6011 6012 6013 6014 6015 6016 6017 6018 6019 6020 6021 6022 6023 6024 6025 6026 6027 6028 6029 6030 6031 6032 6033 6034 6035 6036 6037 6038 6039 6040 6041 6042 6043 6044 6045 6046 6047 6048 6049 6050 6051 6052 6053 6054 6055 6056 6057 6058 6059 6060 6061 6062 6063 6064 6065 6066 6067 6068 6069 6070 6071 6072 6073 6074 6075 6076 6077 6078 6079 6080 6081 6082 6083 6084 6085 6086 6087 6088 6089 6090 6091 6092 6093 6094 6095 6096 6097 6098 6099 6100 6101 6102 6103 6104 6105 6106 6107 6108 6109 6110 6111 6112 6113 6114 6115 6116 6117 6118 6119 6120 6121 6122 6123 6124 6125 6126 6127 6128 6129 6130 6131 6132 6133 6134 6135 6136 6137 6138 6139 6140 6141 6142 6143 6144 6145 6146 6147 6148 6149 6150 6151 6152 6153 6154 6155 6156 6157 6158 6159 6160 6161 6162 6163 6164 6165 6166 6167 6168 6169 6170 6171 6172 6173 6174 6175 6176 6177 6178 6179 6180 6181 6182 6183 6184 6185 6186 6187 6188 6189 6190 6191 6192 6193 6194 6195 6196 6197 6198 6199 6200 6201 6202 6203 6204 6205 6206 6207 6208 6209 6210 6211 6212 6213 6214 6215 6216 6217 6218 6219 6220 6221 6222 6223 6224 6225 6226 6227 6228 6229 6230 6231 6232 6233 6234 6235 6236 6237 6238 6239 6240 6241 6242 6243 6244 6245 6246 6247 6248 6249 6250 6251 6252 6253 6254 6255 6256 6257 6258 6259 6260 6261 6262 6263 6264 6265 6266 6267 6268 6269 6270 6271 6272 6273 6274 6275 6276 6277 6278 6279 6280 6281 6282 6283 6284 6285 6286 6287 6288 6289 6290 6291 6292 6293 6294 6295 6296 6297 6298 6299 6300 6301 6302 6303 6304 6305 6306 6307 6308 6309 6310 6311 6312 6313 6314 6315 6316 6317 6318 6319 6320 6321 6322 6323 6324 6325 6326 6327 6328 6329 6330 6331 6332 6333 6334 6335 6336 6337 6338 6339 6340 6341 6342 6343 6344 6345 6346 6347 6348 6349 6350 6351 6352 6353 6354 6355 6356 6357 6358 6359 6360 6361 6362 6363 6364 6365 6366 6367 6368 6369 6370 6371 6372 6373 6374 6375 6376 6377 6378 6379 6380 6381 6382 6383 6384 6385 6386 6387 6388 6389 6390 6391 6392 6393 6394 6395 6396 6397 6398 6399 6400 6401 6402 6403 6404 6405 6406 6407 6408 6409 6410 6411 6412 6413 6414 6415 6416 6417 6418 6419 6420 6421 6422 6423 6424 6425 6426 6427 6428 6429 6430 6431 6432 6433 6434 6435 6436 6437 6438 6439 6440 6441 6442 6443 6444 6445 6446 6447 6448 6449 6450 6451 6452 6453 6454 6455 6456 6457 6458 6459 6460 6461 6462 6463 6464 6465 6466 6467 6468 6469 6470 6471 6472 6473 6474 6475 6476 6477 6478 6479 6480 6481 6482 6483 6484 6485 6486 6487 6488 6489 6490 6491 6492 6493 6494 6495 6496 6497 6498 6499 6500 6501 6502 6503 6504 6505 6506 6507 6508 6509 6510 6511 6512 6513 6514 6515 6516 6517 6518 6519 6520 6521 6522 6523 6524 6525 6526 6527 6528 6529 6530 6531 6532 6533 6534 6535 6536 6537 6538 6539 6540 6541 6542 6543 6544 6545 6546 6547 6548 6549 6550 6551 6552 6553 6554 6555 6556 6557 6558 6559 6560 6561 6562 6563 6564 6565 6566 6567 6568 6569 6570 6571 6572 6573 6574 6575 6576 6577 6578 6579 6580 6581 6582 6583 6584 6585 6586 6587 6588 6589 6590 6591 6592 6593 6594 6595 6596 6597 6598 6599 6600 6601 6602 6603 6604 6605 6606 6607 6608 6609 6610 6611 6612 6613 6614 6615 6616 6617 6618 6619 6620 6621 6622 6623 6624 6625 6626 6627 6628 6629 6630 6631 6632 6633 6634 6635 6636 6637 6638 6639 6640 6641 6642 6643 6644 6645 6646 6647 6648 6649 6650 6651 6652 6653 6654 6655 6656 6657 6658 6659 6660 6661 6662 6663 6664 6665 6666 6667 6668 6669 6670 6671 6672 6673 6674 6675 6676 6677 6678 6679 6680 6681 6682 6683 6684 6685 6686 6687 6688 6689 6690 6691 6692 6693 6694 6695 6696 6697 6698 6699 6700 6701 6702 6703 6704 6705 6706 6707 6708 6709 6710 6711 6712 6713 6714 6715 6716 6717 6718 6719 6720 6721 6722 6723 6724 6725 6726 6727 6728 6729 6730 6731 6732 6733 6734 6735 6736 6737 6738 6739 6740 6741 6742 6743 6744 6745 6746 6747 6748 6749 6750 6751 6752 6753 6754 6755 6756 6757 6758 6759 6760 6761 6762 6763 6764 6765 6766 6767 6768 6769 6770 6771 6772 6773 6774 6775 6776 6777 6778 6779 6780 6781 6782 6783 6784 6785 6786 6787 6788 6789 6790 6791 6792 6793 6794 6795 6796 6797 6798 6799 6800 6801 6802 6803 6804 6805 6806 6807 6808 6809 6810 6811 6812 6813 6814 6815 6816 6817 6818 6819 6820 6821 6822 6823 6824 6825 6826 6827 6828 6829 6830 6831 6832 6833 6834 6835 6836 6837 6838 6839 6840 6841 6842 6843 6844 6845 6846 6847 6848 6849 6850 6851 6852 6853 6854 6855 6856 6857 6858 6859 6860 6861 6862 6863 6864 6865 6866 6867 6868 6869 6870 6871 6872 6873 6874 6875 6876 6877 6878 6879 6880 6881 6882 6883 6884 6885 6886 6887 6888 6889 6890 6891 6892 6893 6894 6895 6896 6897 6898 6899 6900 6901 6902 6903 6904 6905 6906 6907 6908 6909 6910 6911 6912 6913 6914 6915 6916 6917 6918 6919 6920 6921 6922 6923 6924 6925 6926 6927 6928 6929 6930 6931 6932 6933 6934 6935 6936 6937 6938 6939 6940 6941 6942 6943 6944 6945 6946 6947 6948 6949 6950 6951 6952 6953 6954 6955 6956 6957 6958 6959 6960 6961 6962 6963 6964 6965 6966 6967 6968 6969 6970 6971 6972 6973 6974 6975 6976 6977 6978 6979 6980 6981 6982 6983 6984 6985 6986 6987 6988 6989 6990 6991 6992 6993 6994 6995 6996 6997 6998 6999 7000 7001 7002 7003 7004 7005 7006 7007 7008 7009 7010 7011 7012 7013 7014 7015 7016 7017 7018 7019 7020 7021 7022 7023 7024 7025 7026 7027 7028 7029 7030 7031 7032 7033 7034 7035 7036 7037 7038 7039 7040 7041 7042 7043 7044 7045 7046 7047 7048 7049 7050 7051 7052 7053 7054 7055 7056 7057 7058 7059 7060 7061 7062 7063 7064 7065 7066 7067 7068 7069 7070 7071 7072 7073 7074 7075 7076 7077 7078 7079 7080 7081 7082 7083 7084 7085 7086 7087 7088 7089 7090 7091 7092 7093 7094 7095 7096 7097 7098 7099 7100 7101 7102 7103 7104 7105 7106 7107 7108 7109 7110 7111 7112 7113 7114 7115 7116 7117 7118 7119 7120 7121 7122 7123 7124 7125 7126 7127 7128 7129 7130 7131 7132 7133 7134 7135 7136 7137 7138 7139 7140 7141 7142 7143 7144 7145 7146 7147 7148 7149 7150 7151 7152 7153 7154 7155 7156 7157 7158 7159 7160 7161 7162 7163 7164 7165 7166 7167 7168 7169 7170 7171 7172 7173 7174 7175 7176 7177 7178 7179 7180 7181 7182 7183 7184 7185 7186 7187 7188 7189 7190 7191 7192 7193 7194 7195 7196 7197 7198 7199 7200 7201 7202 7203 7204 7205 7206 7207 7208 7209 7210 7211 7212 7213 7214 7215 7216 7217 7218 7219 7220 7221 7222 7223 7224 7225 7226 7227 7228 7229 7230 7231 7232 7233 7234 7235 7236 7237 7238 7239 7240 7241 7242 7243 7244 7245 7246 7247 7248 7249 7250 7251 7252 7253 7254 7255 7256 7257 7258 7259 7260 7261 7262 7263 7264 7265 7266 7267 7268 7269 7270 7271 7272 7273 7274 7275 7276 7277 7278 7279 7280 7281 7282 7283 7284 7285 7286 7287 7288 7289 7290 7291 7292 7293 7294 7295 7296 7297 7298 7299 7300 7301 7302 7303 7304 7305 7306 7307 7308 7309 7310 7311 7312 7313 7314 7315 7316 7317 7318 7319 7320 7321 7322 7323 7324 7325 7326 7327 7328 7329 7330 7331 7332 7333 7334 7335 7336 7337 7338 7339 7340 7341 7342 7343 7344 7345 7346 7347 7348 7349 7350 7351 7352 7353 7354 7355 7356 7357 7358 7359 7360 7361 7362 7363 7364 7365 7366 7367 7368 7369 7370 7371 7372 7373 7374 7375 7376 7377 7378 7379 7380 7381 7382 7383 7384 7385 7386 7387 7388 7389 7390 7391 7392 7393 7394 7395 7396 7397 7398 7399 7400 7401 7402 7403 7404 7405 7406 7407 7408 7409 7410 7411 7412 7413 7414 7415 7416 7417 7418 7419 7420 7421 7422 7423 7424 7425 7426 7427 7428 7429 7430 7431 7432 7433 7434 7435 7436 7437 7438 7439 7440 7441 7442 7443 7444 7445 7446 7447 7448 7449 7450 7451 7452 7453 7454 7455 7456 7457 7458 7459 7460 7461 7462 7463 7464 7465 7466 7467 7468 7469 7470 7471 7472 7473 7474 7475 7476 7477 7478 7479 7480 7481 7482 7483 7484 7485 7486 7487 7488 7489 7490 7491 7492 7493 7494 7495 7496 7497 7498 7499 7500 7501 7502 7503 7504 7505 7506 7507 7508 7509 7510 7511 7512 7513 7514 7515 7516 7517 7518 7519 7520 7521 7522 7523 7524 7525 7526 7527 7528 7529 7530 7531 7532 7533 7534 7535 7536 7537 7538 7539 7540 7541 7542 7543 7544 7545 7546 7547 7548 7549 7550 7551 7552 7553 7554 7555 7556 7557 7558 7559 7560 7561 7562 7563 7564 7565 7566 7567 7568 7569 7570 7571 7572 7573 7574 7575 7576 7577 7578 7579 7580 7581 7582 7583 7584 7585 7586 7587 7588 7589 7590 7591 7592 7593 7594 7595 7596 7597 7598 7599 7600 7601 7602 7603 7604 7605 7606 7607 7608 7609 7610 7611 7612 7613 7614 7615 7616 7617 7618 7619 7620 7621 7622 7623 7624 7625 7626 7627 7628 7629 7630 7631 7632 7633 7634 7635 7636 7637 7638 7639 7640 7641 7642 7643 7644 7645 7646 7647 7648 7649 7650 7651 7652 7653 7654 7655 7656 7657 7658 7659 7660 7661 7662 7663 7664 7665 7666 7667 7668 7669 7670 7671 7672 7673 7674 7675 7676 7677 7678 7679 7680 7681 7682 7683 7684 7685 7686 7687 7688 7689 7690 7691 7692 7693 7694 7695 7696 7697 7698 7699 7700 7701 7702 7703 7704 7705 7706 7707 7708 7709 7710 7711 7712 7713 7714 7715 7716 7717 7718 7719 7720 7721 7722 7723 7724 7725 7726 7727 7728 7729 7730 7731 7732 7733 7734 7735 7736 7737 7738 7739 7740 7741 7742 7743 7744 7745 7746 7747 7748 7749 7750 7751 7752 7753 7754 7755 7756 7757 7758 7759 7760 7761 7762 7763 7764 7765 7766 7767 7768 7769 7770 7771 7772 7773 7774 7775 7776 7777 7778 7779 7780 7781 7782 7783 7784 7785 7786 7787 7788 7789 7790 7791 7792 7793 7794 7795 7796 7797 7798 7799 7800 7801 7802 7803 7804 7805 7806 7807 7808 7809 7810 7811 7812 7813 7814 7815 7816 7817 7818 7819 7820 7821 7822 7823 7824 7825 7826 7827 7828 7829 7830 7831 7832 7833 7834 7835 7836 7837 7838 7839 7840 7841 7842 7843 7844 7845 7846 7847 7848 7849 7850 7851 7852 7853 7854 7855 7856 7857 7858 7859 7860 7861 7862 7863 7864 7865 7866 7867 7868 7869 7870 7871 7872 7873 7874 7875 7876 7877 7878 7879 7880 7881 7882 7883 7884 7885 7886 7887 7888 7889 7890 7891 7892 7893 7894 7895 7896 7897 7898 7899 7900 7901 7902 7903 7904 7905 7906 7907 7908 7909 7910 7911 7912 7913 7914 7915 7916 7917 7918 7919 7920 7921 7922 7923 7924 7925 7926 7927 7928 7929 7930 7931 7932 7933 7934 7935 7936 7937 7938 7939 7940 7941 7942 7943 7944 7945 7946 7947 7948 7949 7950 7951 7952 7953 7954 7955 7956 7957 7958 7959 7960 7961 7962 7963 7964 7965 7966 7967 7968 7969 7970 7971 7972 7973 7974 7975 7976 7977 7978 7979 7980 7981 7982 7983 7984 7985 7986 7987 7988 7989 7990 7991 7992 7993 7994 7995 7996 7997 7998 7999 8000 8001 8002 8003 8004 8005 8006 8007 8008 8009 8010 8011 8012 8013 8014 8015 8016 8017 8018 8019 8020 8021 8022 8023 8024 8025 8026 8027 8028 8029 8030 8031 8032 8033 8034 8035 8036 8037 8038 8039 8040 8041 8042 8043 8044 8045 8046 8047 8048 8049 8050 8051 8052 8053 8054 8055 8056 8057 8058 8059 8060 8061 8062 8063 8064 8065 8066 8067 8068 8069 8070 8071 8072 8073 8074 8075 8076 8077 8078 8079 8080 8081 8082 8083 8084 8085 8086 8087 8088 8089 8090 8091 8092 8093 8094 8095 8096 8097 8098 8099 8100 8101 8102 8103 8104 8105 8106 8107 8108 8109 8110 8111 8112 8113 8114 8115 8116 8117 8118 8119 8120 8121 8122 8123 8124 8125 8126 8127 8128 8129 8130 8131 8132 8133 8134 8135 8136 8137 8138 8139 8140 8141 8142 8143 8144 8145 8146 8147 8148 8149 8150 8151 8152 8153 8154 8155 8156 8157 8158 8159 8160 8161 8162 8163 8164 8165 8166 8167 8168 8169 8170 8171 8172 8173 8174 8175 8176 8177 8178 8179 8180 8181 8182 8183 8184 8185 8186 8187 8188 8189 8190 8191 8192 8193 8194 8195 8196 8197 8198 8199 8200 8201 8202 8203 8204 8205 8206 8207 8208 8209 8210 8211 8212 8213 8214 8215 8216 8217 8218 8219 8220 8221 8222 8223 8224 8225 8226 8227 8228 8229 8230 8231 8232 8233 8234 8235 8236 8237 8238 8239 8240 8241 8242 8243 8244 8245 8246 8247 8248 8249 8250 8251 8252 8253 8254 8255 8256 8257 8258 8259 8260 8261 8262 8263 8264 8265 8266 8267 8268 8269 8270 8271 8272 8273 8274 8275 8276 8277 8278 8279 8280 8281 8282 8283 8284 8285 8286 8287 8288 8289 8290 8291 8292 8293 8294 8295 8296 8297 8298 8299 8300 8301 8302 8303 8304 8305 8306 8307 8308 8309 8310 8311 8312 8313 8314 8315 8316 8317 8318 8319 8320 8321 8322 8323 8324 8325 8326 8327 8328 8329 8330 8331 8332 8333 8334 8335 8336 8337 8338 8339 8340 8341 8342 8343 8344 8345 8346 8347 8348 8349 8350 8351 8352 8353 8354 8355 8356 8357 8358 8359 8360 8361 8362 8363 8364 8365 8366 8367 8368 8369 8370 8371 8372 8373 8374 8375 8376 8377 8378 8379 8380 8381 8382 8383 8384 8385 8386 8387 8388 8389 8390 8391 8392 8393 8394 8395 8396 8397 8398 8399 8400 8401 8402 8403 8404 8405 8406 8407 8408 8409 8410 8411 8412 8413 8414 8415 8416 8417 8418 8419 8420 8421 8422 8423 8424 8425 8426 8427 8428 8429 8430 8431 8432 8433 8434 8435 8436 8437 8438 8439 8440 8441 8442 8443 8444 8445 8446 8447 8448 8449 8450 8451 8452 8453 8454 8455 8456 8457 8458 8459 8460 8461 8462 8463 8464 8465 8466 8467 8468 8469 8470 8471 8472 8473 8474 8475 8476 8477 8478 8479 8480 8481 8482 8483 8484 8485 8486 8487 8488 8489 8490 8491 8492 8493 8494 8495 8496 8497 8498 8499 8500 8501 8502 8503 8504 8505 8506 8507 8508 8509 8510 8511 8512 8513 8514 8515 8516 8517 8518 8519 8520 8521 8522 8523 8524 8525 8526 8527 8528 8529 8530 8531 8532 8533 8534 8535 8536 8537 8538 8539 8540 8541 8542 8543 8544 8545 8546 8547 8548 8549 8550 8551 8552 8553 8554 8555 8556 8557 8558 8559 8560 8561 8562 8563 8564 8565 8566 8567 8568 8569 8570 8571 8572 8573 8574 8575 8576 8577 8578 8579 8580 8581 8582 8583 8584 8585 8586 8587 8588 8589 8590 8591 8592 8593 8594 8595 8596 8597 8598 8599 8600 8601 8602 8603 8604 8605 8606 8607 8608 8609 8610 8611 8612 8613 8614 8615 8616 8617 8618 8619 8620 8621 8622 8623 8624 8625 8626 8627 8628 8629 8630 8631 8632 8633 8634 8635 8636 8637 8638 8639 8640 8641 8642 8643 8644 8645 8646 8647 8648 8649 8650 8651 8652 8653 8654 8655 8656 8657 8658 8659 8660 8661 8662 8663 8664 8665 8666 8667 8668 8669 8670 8671 8672 8673 8674 8675 8676 8677 8678 8679 8680 8681 8682 8683 8684 8685 8686 8687 8688 8689 8690 8691 8692 8693 8694 8695 8696 8697 8698 8699 8700 8701 8702 8703 8704 8705 8706 8707 8708 8709 8710 8711 8712 8713 8714 8715 8716 8717 8718 8719 8720 8721 8722 8723 8724 8725 8726 8727 8728 8729 8730 8731 8732 8733 8734 8735 8736 8737 8738 8739 8740 8741 8742 8743 8744 8745 8746 8747 8748 8749 8750 8751 8752 8753 8754 8755 8756 8757 8758 8759 8760 8761 8762 8763 8764 8765 8766 8767 8768 8769 8770 8771 8772 8773 8774 8775 8776 8777 8778 8779 8780 8781 8782 8783 8784 8785 8786 8787 8788 8789 8790 8791 8792 8793 8794 8795 8796 8797 8798 8799 8800 8801 8802 8803 8804 8805 8806 8807 8808 8809 8810 8811 8812 8813 8814 8815 8816 8817 8818 8819 8820 8821 8822 8823 8824 8825 8826 8827 8828 8829 8830 8831 8832 8833 8834 8835 8836 8837 8838 8839 8840 8841 8842 8843 8844 8845 8846 8847 8848 8849 8850 8851 8852 8853 8854 8855 8856 8857 8858 8859 8860 8861 8862 8863 8864 8865 8866 8867 8868 8869 8870 8871 8872 8873 8874 8875 8876 8877 8878 8879 8880 8881 8882 8883 8884 8885 8886 8887 8888 8889 8890 8891 8892 8893 8894 8895 8896 8897 8898 8899 8900 8901 8902 8903 8904 8905 8906 8907 8908 8909 8910 8911 8912 8913 8914 8915 8916 8917 8918 8919 8920 8921 8922 8923 8924 8925 8926 8927 8928 8929 8930 8931 8932 8933 8934 8935 8936 8937 8938 8939 8940 8941 8942 8943 8944 8945 8946 8947 8948 8949 8950 8951 8952 8953 8954 8955 8956 8957 8958 8959 8960 8961 8962 8963 8964 8965 8966 8967 8968 8969 8970 8971 8972 8973 8974 8975 8976 8977 8978 8979 8980 8981 8982 8983 8984 8985 8986 8987 8988 8989 8990 8991 8992 8993 8994 8995 8996 8997 8998 8999 9000 9001 9002 9003 9004 9005 9006 9007 9008 9009 9010 9011 9012 9013 9014 9015 9016 9017 9018 9019 9020 9021 9022 9023 9024 9025 9026 9027 9028 9029 9030 9031 9032 9033 9034 9035 9036 9037 9038 9039 9040 9041 9042 9043 9044 9045 9046 9047 9048 9049 9050 9051 9052 9053 9054 9055 9056 9057 9058 9059 9060 9061 9062 9063 9064 9065 9066 9067 9068 9069 9070 9071 9072 9073 9074 9075 9076 9077 9078 9079 9080 9081 9082 9083 9084 9085 9086 9087 9088 9089 9090 9091 9092 9093 9094 9095 9096 9097 9098 9099 9100 9101 9102 9103 9104 9105 9106 9107 9108 9109 9110 9111 9112 9113 9114 9115 9116 9117 9118 9119 9120 9121 9122 9123 9124 9125 9126 9127 9128 9129 9130 9131 9132 9133 9134 9135 9136 9137 9138 9139 9140 9141 9142 9143 9144 9145 9146 9147 9148 9149 9150 9151 9152 9153 9154 9155 9156 9157 9158 9159 9160 9161 9162 9163 9164 9165 9166 9167 9168 9169 9170 9171 9172 9173 9174 9175 9176 9177 9178 9179 9180 9181 9182 9183 9184 9185 9186 9187 9188 9189 9190 9191 9192 9193 9194 9195 9196 9197 9198 9199 9200 9201 9202 9203 9204 9205 9206 9207 9208 9209 9210 9211 9212 9213 9214 9215 9216 9217 9218 9219 9220 9221 9222 9223 9224 9225 9226 9227 9228 9229 9230 9231 9232 9233 9234 9235 9236 9237 9238 9239 9240 9241 9242 9243 9244 9245 9246 9247 9248 9249 9250 9251 9252 9253 9254 9255 9256 9257 9258 9259 9260 9261 9262 9263 9264 9265 9266 9267 9268 9269 9270 9271 9272 9273 9274 9275 9276 9277 9278 9279 9280 9281 9282 9283 9284 9285 9286 9287 9288 9289 9290 9291 9292 9293 9294 9295 9296 9297 9298 9299 9300 9301 9302 9303 9304 9305 9306 9307 9308 9309 9310 9311 9312 9313 9314 9315 9316 9317 9318 9319 9320 9321 9322 9323 9324 9325 9326 9327 9328 9329 9330 9331 9332 9333 9334 9335 9336 9337 9338 9339 9340 9341 9342 9343 9344 9345 9346 9347 9348 9349 9350 9351 9352 9353 9354 9355 9356 9357 9358 9359 9360 9361 9362 9363 9364 9365 9366 9367 9368 9369 9370 9371 9372 9373 9374 9375 9376 9377 9378 9379 9380 9381 9382 9383 9384 9385 9386 9387 9388 9389 9390 9391 9392 9393 9394 9395 9396 9397 9398 9399 9400 9401 9402 9403 9404 9405 9406 9407 9408 9409 9410 9411 9412 9413 9414 9415 9416 9417 9418 9419 9420 9421 9422 9423 9424 9425 9426 9427 9428 9429 9430 9431 9432 9433 9434 9435 9436 9437 9438 9439 9440 9441 9442 9443 9444 9445 9446 9447 9448 9449 9450 9451 9452 9453 9454 9455 9456 9457 9458 9459 9460 9461 9462 9463 9464 9465 9466 9467 9468 9469 9470 9471 9472 9473 9474 9475 9476 9477 9478 9479 9480 9481 9482 9483 9484 9485 9486 9487 9488 9489 9490 9491 9492 9493 9494 9495 9496 9497 9498 9499 9500 9501 9502 9503 9504 9505 9506 9507 9508 9509 9510 9511 9512 9513 9514 9515 9516 9517 9518 9519 9520 9521 9522 9523 9524 9525 9526 9527 9528 9529 9530 9531 9532 9533 9534 9535 9536 9537 9538 9539 9540 9541 9542 9543 9544 9545 9546 9547 9548 9549 9550 9551 9552 9553 9554 9555 9556 9557 9558 9559 9560 9561 9562 9563 9564 9565 9566 9567 9568 9569 9570 9571 9572 9573 9574 9575 9576 9577 9578 9579 9580 9581 9582 9583 9584 9585 9586 9587 9588 9589 9590 9591 9592 9593 9594 9595 9596 9597 9598 9599 9600 9601 9602 9603 9604 9605 9606 9607 9608 9609 9610 9611 9612 9613 9614 9615 9616 9617 9618 9619 9620 9621 9622 9623 9624 9625 9626 9627 9628 9629 9630 9631 9632 9633 9634 9635 9636 9637 9638 9639 9640 9641 9642 9643 9644 9645 9646 9647 9648 9649 9650 9651 9652 9653 9654 9655 9656 9657 9658 9659 9660 9661 9662 9663 9664 9665 9666 9667 9668 9669 9670 9671 9672 9673 9674 9675 9676 9677 9678 9679 9680 9681 9682 9683 9684 9685 9686 9687 9688 9689 9690 9691 9692 9693 9694 9695 9696 9697 9698 9699 9700 9701 9702 9703 9704 9705 9706 9707 9708 9709 9710 9711 9712 9713 9714 9715 9716 9717 9718 9719 9720 9721 9722 9723 9724 9725 9726 9727 9728 9729 9730 9731 9732 9733 9734 9735 9736 9737 9738 9739 9740 9741 9742 9743 9744 9745 9746 9747 9748 9749 9750 9751 9752 9753 9754 9755 9756 9757 9758 9759 9760 9761 9762 9763 9764 9765 9766 9767 9768 9769 9770 9771 9772 9773 9774 9775 9776 9777 9778 9779 9780 9781 9782 9783 9784 |
/*! * Chart.js * http://chartjs.org/ * Version: 2.1.2 * * Copyright 2016 Nick Downie * Released under the MIT license * https://github.com/chartjs/Chart.js/blob/master/LICENSE.md */ (function e(t,n,r){function s(o,u){if(!n[o]){if(!t[o]){var a=typeof require=="function"&&require;if(!u&&a)return a(o,!0);if(i)return i(o,!0);var f=new Error("Cannot find module '"+o+"'");throw f.code="MODULE_NOT_FOUND",f}var l=n[o]={exports:{}};t[o][0].call(l.exports,function(e){var n=t[o][1][e];return s(n?n:e)},l,l.exports,e,t,n,r)}return n[o].exports}var i=typeof require=="function"&&require;for(var o=0;o<r.length;o++)s(r[o]);return s})({1:[function(require,module,exports){ },{}],2:[function(require,module,exports){ /* MIT license */ var colorNames = require('color-name'); module.exports = { getRgba: getRgba, getHsla: getHsla, getRgb: getRgb, getHsl: getHsl, getHwb: getHwb, getAlpha: getAlpha, hexString: hexString, rgbString: rgbString, rgbaString: rgbaString, percentString: percentString, percentaString: percentaString, hslString: hslString, hslaString: hslaString, hwbString: hwbString, keyword: keyword } function getRgba(string) { if (!string) { return; } var abbr = /^#([a-fA-F0-9]{3})$/, hex = /^#([a-fA-F0-9]{6})$/, rgba = /^rgba?\(\s*([+-]?\d+)\s*,\s*([+-]?\d+)\s*,\s*([+-]?\d+)\s*(?:,\s*([+-]?[\d\.]+)\s*)?\)$/, per = /^rgba?\(\s*([+-]?[\d\.]+)\%\s*,\s*([+-]?[\d\.]+)\%\s*,\s*([+-]?[\d\.]+)\%\s*(?:,\s*([+-]?[\d\.]+)\s*)?\)$/, keyword = /(\w+)/; var rgb = [0, 0, 0], a = 1, match = string.match(abbr); if (match) { match = match[1]; for (var i = 0; i < rgb.length; i++) { rgb[i] = parseInt(match[i] + match[i], 16); } } else if (match = string.match(hex)) { match = match[1]; for (var i = 0; i < rgb.length; i++) { rgb[i] = parseInt(match.slice(i * 2, i * 2 + 2), 16); } } else if (match = string.match(rgba)) { for (var i = 0; i < rgb.length; i++) { rgb[i] = parseInt(match[i + 1]); } a = parseFloat(match[4]); } else if (match = string.match(per)) { for (var i = 0; i < rgb.length; i++) { rgb[i] = Math.round(parseFloat(match[i + 1]) * 2.55); } a = parseFloat(match[4]); } else if (match = string.match(keyword)) { if (match[1] == "transparent") { return [0, 0, 0, 0]; } rgb = colorNames[match[1]]; if (!rgb) { return; } } for (var i = 0; i < rgb.length; i++) { rgb[i] = scale(rgb[i], 0, 255); } if (!a && a != 0) { a = 1; } else { a = scale(a, 0, 1); } rgb[3] = a; return rgb; } function getHsla(string) { if (!string) { return; } var hsl = /^hsla?\(\s*([+-]?\d+)(?:deg)?\s*,\s*([+-]?[\d\.]+)%\s*,\s*([+-]?[\d\.]+)%\s*(?:,\s*([+-]?[\d\.]+)\s*)?\)/; var match = string.match(hsl); if (match) { var alpha = parseFloat(match[4]); var h = scale(parseInt(match[1]), 0, 360), s = scale(parseFloat(match[2]), 0, 100), l = scale(parseFloat(match[3]), 0, 100), a = scale(isNaN(alpha) ? 1 : alpha, 0, 1); return [h, s, l, a]; } } function getHwb(string) { if (!string) { return; } var hwb = /^hwb\(\s*([+-]?\d+)(?:deg)?\s*,\s*([+-]?[\d\.]+)%\s*,\s*([+-]?[\d\.]+)%\s*(?:,\s*([+-]?[\d\.]+)\s*)?\)/; var match = string.match(hwb); if (match) { var alpha = parseFloat(match[4]); var h = scale(parseInt(match[1]), 0, 360), w = scale(parseFloat(match[2]), 0, 100), b = scale(parseFloat(match[3]), 0, 100), a = scale(isNaN(alpha) ? 1 : alpha, 0, 1); return [h, w, b, a]; } } function getRgb(string) { var rgba = getRgba(string); return rgba && rgba.slice(0, 3); } function getHsl(string) { var hsla = getHsla(string); return hsla && hsla.slice(0, 3); } function getAlpha(string) { var vals = getRgba(string); if (vals) { return vals[3]; } else if (vals = getHsla(string)) { return vals[3]; } else if (vals = getHwb(string)) { return vals[3]; } } // generators function hexString(rgb) { return "#" + hexDouble(rgb[0]) + hexDouble(rgb[1]) + hexDouble(rgb[2]); } function rgbString(rgba, alpha) { if (alpha < 1 || (rgba[3] && rgba[3] < 1)) { return rgbaString(rgba, alpha); } return "rgb(" + rgba[0] + ", " + rgba[1] + ", " + rgba[2] + ")"; } function rgbaString(rgba, alpha) { if (alpha === undefined) { alpha = (rgba[3] !== undefined ? rgba[3] : 1); } return "rgba(" + rgba[0] + ", " + rgba[1] + ", " + rgba[2] + ", " + alpha + ")"; } function percentString(rgba, alpha) { if (alpha < 1 || (rgba[3] && rgba[3] < 1)) { return percentaString(rgba, alpha); } var r = Math.round(rgba[0]/255 * 100), g = Math.round(rgba[1]/255 * 100), b = Math.round(rgba[2]/255 * 100); return "rgb(" + r + "%, " + g + "%, " + b + "%)"; } function percentaString(rgba, alpha) { var r = Math.round(rgba[0]/255 * 100), g = Math.round(rgba[1]/255 * 100), b = Math.round(rgba[2]/255 * 100); return "rgba(" + r + "%, " + g + "%, " + b + "%, " + (alpha || rgba[3] || 1) + ")"; } function hslString(hsla, alpha) { if (alpha < 1 || (hsla[3] && hsla[3] < 1)) { return hslaString(hsla, alpha); } return "hsl(" + hsla[0] + ", " + hsla[1] + "%, " + hsla[2] + "%)"; } function hslaString(hsla, alpha) { if (alpha === undefined) { alpha = (hsla[3] !== undefined ? hsla[3] : 1); } return "hsla(" + hsla[0] + ", " + hsla[1] + "%, " + hsla[2] + "%, " + alpha + ")"; } // hwb is a bit different than rgb(a) & hsl(a) since there is no alpha specific syntax // (hwb have alpha optional & 1 is default value) function hwbString(hwb, alpha) { if (alpha === undefined) { alpha = (hwb[3] !== undefined ? hwb[3] : 1); } return "hwb(" + hwb[0] + ", " + hwb[1] + "%, " + hwb[2] + "%" + (alpha !== undefined && alpha !== 1 ? ", " + alpha : "") + ")"; } function keyword(rgb) { return reverseNames[rgb.slice(0, 3)]; } // helpers function scale(num, min, max) { return Math.min(Math.max(min, num), max); } function hexDouble(num) { var str = num.toString(16).toUpperCase(); return (str.length < 2) ? "0" + str : str; } //create a list of reverse color names var reverseNames = {}; for (var name in colorNames) { reverseNames[colorNames[name]] = name; } },{"color-name":6}],3:[function(require,module,exports){ /* MIT license */ var convert = require("color-convert"), string = require("chartjs-color-string"); var Color = function(obj) { if (obj instanceof Color) return obj; if (!(this instanceof Color)) return new Color(obj); this.values = { rgb: [0, 0, 0], hsl: [0, 0, 0], hsv: [0, 0, 0], hwb: [0, 0, 0], cmyk: [0, 0, 0, 0], alpha: 1 } // parse Color() argument if (typeof obj == "string") { var vals = string.getRgba(obj); if (vals) { this.setValues("rgb", vals); } else if (vals = string.getHsla(obj)) { this.setValues("hsl", vals); } else if (vals = string.getHwb(obj)) { this.setValues("hwb", vals); } else { throw new Error("Unable to parse color from string \"" + obj + "\""); } } else if (typeof obj == "object") { var vals = obj; if (vals["r"] !== undefined || vals["red"] !== undefined) { this.setValues("rgb", vals) } else if (vals["l"] !== undefined || vals["lightness"] !== undefined) { this.setValues("hsl", vals) } else if (vals["v"] !== undefined || vals["value"] !== undefined) { this.setValues("hsv", vals) } else if (vals["w"] !== undefined || vals["whiteness"] !== undefined) { this.setValues("hwb", vals) } else if (vals["c"] !== undefined || vals["cyan"] !== undefined) { this.setValues("cmyk", vals) } else { throw new Error("Unable to parse color from object " + JSON.stringify(obj)); } } } Color.prototype = { rgb: function(vals) { return this.setSpace("rgb", arguments); }, hsl: function(vals) { return this.setSpace("hsl", arguments); }, hsv: function(vals) { return this.setSpace("hsv", arguments); }, hwb: function(vals) { return this.setSpace("hwb", arguments); }, cmyk: function(vals) { return this.setSpace("cmyk", arguments); }, rgbArray: function() { return this.values.rgb; }, hslArray: function() { return this.values.hsl; }, hsvArray: function() { return this.values.hsv; }, hwbArray: function() { if (this.values.alpha !== 1) { return this.values.hwb.concat([this.values.alpha]) } return this.values.hwb; }, cmykArray: function() { return this.values.cmyk; }, rgbaArray: function() { var rgb = this.values.rgb; return rgb.concat([this.values.alpha]); }, hslaArray: function() { var hsl = this.values.hsl; return hsl.concat([this.values.alpha]); }, alpha: function(val) { if (val === undefined) { return this.values.alpha; } this.setValues("alpha", val); return this; }, red: function(val) { return this.setChannel("rgb", 0, val); }, green: function(val) { return this.setChannel("rgb", 1, val); }, blue: function(val) { return this.setChannel("rgb", 2, val); }, hue: function(val) { return this.setChannel("hsl", 0, val); }, saturation: function(val) { return this.setChannel("hsl", 1, val); }, lightness: function(val) { return this.setChannel("hsl", 2, val); }, saturationv: function(val) { return this.setChannel("hsv", 1, val); }, whiteness: function(val) { return this.setChannel("hwb", 1, val); }, blackness: function(val) { return this.setChannel("hwb", 2, val); }, value: function(val) { return this.setChannel("hsv", 2, val); }, cyan: function(val) { return this.setChannel("cmyk", 0, val); }, magenta: function(val) { return this.setChannel("cmyk", 1, val); }, yellow: function(val) { return this.setChannel("cmyk", 2, val); }, black: function(val) { return this.setChannel("cmyk", 3, val); }, hexString: function() { return string.hexString(this.values.rgb); }, rgbString: function() { return string.rgbString(this.values.rgb, this.values.alpha); }, rgbaString: function() { return string.rgbaString(this.values.rgb, this.values.alpha); }, percentString: function() { return string.percentString(this.values.rgb, this.values.alpha); }, hslString: function() { return string.hslString(this.values.hsl, this.values.alpha); }, hslaString: function() { return string.hslaString(this.values.hsl, this.values.alpha); }, hwbString: function() { return string.hwbString(this.values.hwb, this.values.alpha); }, keyword: function() { return string.keyword(this.values.rgb, this.values.alpha); }, rgbNumber: function() { return (this.values.rgb[0] << 16) | (this.values.rgb[1] << 8) | this.values.rgb[2]; }, luminosity: function() { // http://www.w3.org/TR/WCAG20/#relativeluminancedef var rgb = this.values.rgb; var lum = []; for (var i = 0; i < rgb.length; i++) { var chan = rgb[i] / 255; lum[i] = (chan <= 0.03928) ? chan / 12.92 : Math.pow(((chan + 0.055) / 1.055), 2.4) } return 0.2126 * lum[0] + 0.7152 * lum[1] + 0.0722 * lum[2]; }, contrast: function(color2) { // http://www.w3.org/TR/WCAG20/#contrast-ratiodef var lum1 = this.luminosity(); var lum2 = color2.luminosity(); if (lum1 > lum2) { return (lum1 + 0.05) / (lum2 + 0.05) }; return (lum2 + 0.05) / (lum1 + 0.05); }, level: function(color2) { var contrastRatio = this.contrast(color2); return (contrastRatio >= 7.1) ? 'AAA' : (contrastRatio >= 4.5) ? 'AA' : ''; }, dark: function() { // YIQ equation from http://24ways.org/2010/calculating-color-contrast var rgb = this.values.rgb, yiq = (rgb[0] * 299 + rgb[1] * 587 + rgb[2] * 114) / 1000; return yiq < 128; }, light: function() { return !this.dark(); }, negate: function() { var rgb = [] for (var i = 0; i < 3; i++) { rgb[i] = 255 - this.values.rgb[i]; } this.setValues("rgb", rgb); return this; }, lighten: function(ratio) { this.values.hsl[2] += this.values.hsl[2] * ratio; this.setValues("hsl", this.values.hsl); return this; }, darken: function(ratio) { this.values.hsl[2] -= this.values.hsl[2] * ratio; this.setValues("hsl", this.values.hsl); return this; }, saturate: function(ratio) { this.values.hsl[1] += this.values.hsl[1] * ratio; this.setValues("hsl", this.values.hsl); return this; }, desaturate: function(ratio) { this.values.hsl[1] -= this.values.hsl[1] * ratio; this.setValues("hsl", this.values.hsl); return this; }, whiten: function(ratio) { this.values.hwb[1] += this.values.hwb[1] * ratio; this.setValues("hwb", this.values.hwb); return this; }, blacken: function(ratio) { this.values.hwb[2] += this.values.hwb[2] * ratio; this.setValues("hwb", this.values.hwb); return this; }, greyscale: function() { var rgb = this.values.rgb; // http://en.wikipedia.org/wiki/Grayscale#Converting_color_to_grayscale var val = rgb[0] * 0.3 + rgb[1] * 0.59 + rgb[2] * 0.11; this.setValues("rgb", [val, val, val]); return this; }, clearer: function(ratio) { this.setValues("alpha", this.values.alpha - (this.values.alpha * ratio)); return this; }, opaquer: function(ratio) { this.setValues("alpha", this.values.alpha + (this.values.alpha * ratio)); return this; }, rotate: function(degrees) { var hue = this.values.hsl[0]; hue = (hue + degrees) % 360; hue = hue < 0 ? 360 + hue : hue; this.values.hsl[0] = hue; this.setValues("hsl", this.values.hsl); return this; }, mix: function(color2, weight) { weight = 1 - (weight == null ? 0.5 : weight); // algorithm from Sass's mix(). Ratio of first color in mix is // determined by the alphas of both colors and the weight var t1 = weight * 2 - 1, d = this.alpha() - color2.alpha(); var weight1 = (((t1 * d == -1) ? t1 : (t1 + d) / (1 + t1 * d)) + 1) / 2; var weight2 = 1 - weight1; var rgb = this.rgbArray(); var rgb2 = color2.rgbArray(); for (var i = 0; i < rgb.length; i++) { rgb[i] = rgb[i] * weight1 + rgb2[i] * weight2; } this.setValues("rgb", rgb); var alpha = this.alpha() * weight + color2.alpha() * (1 - weight); this.setValues("alpha", alpha); return this; }, toJSON: function() { return this.rgb(); }, clone: function() { return new Color(this.rgb()); } } Color.prototype.getValues = function(space) { var vals = {}; for (var i = 0; i < space.length; i++) { vals[space.charAt(i)] = this.values[space][i]; } if (this.values.alpha != 1) { vals["a"] = this.values.alpha; } // {r: 255, g: 255, b: 255, a: 0.4} return vals; } Color.prototype.setValues = function(space, vals) { var spaces = { "rgb": ["red", "green", "blue"], "hsl": ["hue", "saturation", "lightness"], "hsv": ["hue", "saturation", "value"], "hwb": ["hue", "whiteness", "blackness"], "cmyk": ["cyan", "magenta", "yellow", "black"] }; var maxes = { "rgb": [255, 255, 255], "hsl": [360, 100, 100], "hsv": [360, 100, 100], "hwb": [360, 100, 100], "cmyk": [100, 100, 100, 100] }; var alpha = 1; if (space == "alpha") { alpha = vals; } else if (vals.length) { // [10, 10, 10] this.values[space] = vals.slice(0, space.length); alpha = vals[space.length]; } else if (vals[space.charAt(0)] !== undefined) { // {r: 10, g: 10, b: 10} for (var i = 0; i < space.length; i++) { this.values[space][i] = vals[space.charAt(i)]; } alpha = vals.a; } else if (vals[spaces[space][0]] !== undefined) { // {red: 10, green: 10, blue: 10} var chans = spaces[space]; for (var i = 0; i < space.length; i++) { this.values[space][i] = vals[chans[i]]; } alpha = vals.alpha; } this.values.alpha = Math.max(0, Math.min(1, (alpha !== undefined ? alpha : this.values.alpha))); if (space == "alpha") { return; } // cap values of the space prior converting all values for (var i = 0; i < space.length; i++) { var capped = Math.max(0, Math.min(maxes[space][i], this.values[space][i])); this.values[space][i] = Math.round(capped); } // convert to all the other color spaces for (var sname in spaces) { if (sname != space) { this.values[sname] = convert[space][sname](this.values[space]) } // cap values for (var i = 0; i < sname.length; i++) { var capped = Math.max(0, Math.min(maxes[sname][i], this.values[sname][i])); this.values[sname][i] = Math.round(capped); } } return true; } Color.prototype.setSpace = function(space, args) { var vals = args[0]; if (vals === undefined) { // color.rgb() return this.getValues(space); } // color.rgb(10, 10, 10) if (typeof vals == "number") { vals = Array.prototype.slice.call(args); } this.setValues(space, vals); return this; } Color.prototype.setChannel = function(space, index, val) { if (val === undefined) { // color.red() return this.values[space][index]; } // color.red(100) this.values[space][index] = val; this.setValues(space, this.values[space]); return this; } window.Color = module.exports = Color },{"chartjs-color-string":2,"color-convert":5}],4:[function(require,module,exports){ /* MIT license */ module.exports = { rgb2hsl: rgb2hsl, rgb2hsv: rgb2hsv, rgb2hwb: rgb2hwb, rgb2cmyk: rgb2cmyk, rgb2keyword: rgb2keyword, rgb2xyz: rgb2xyz, rgb2lab: rgb2lab, rgb2lch: rgb2lch, hsl2rgb: hsl2rgb, hsl2hsv: hsl2hsv, hsl2hwb: hsl2hwb, hsl2cmyk: hsl2cmyk, hsl2keyword: hsl2keyword, hsv2rgb: hsv2rgb, hsv2hsl: hsv2hsl, hsv2hwb: hsv2hwb, hsv2cmyk: hsv2cmyk, hsv2keyword: hsv2keyword, hwb2rgb: hwb2rgb, hwb2hsl: hwb2hsl, hwb2hsv: hwb2hsv, hwb2cmyk: hwb2cmyk, hwb2keyword: hwb2keyword, cmyk2rgb: cmyk2rgb, cmyk2hsl: cmyk2hsl, cmyk2hsv: cmyk2hsv, cmyk2hwb: cmyk2hwb, cmyk2keyword: cmyk2keyword, keyword2rgb: keyword2rgb, keyword2hsl: keyword2hsl, keyword2hsv: keyword2hsv, keyword2hwb: keyword2hwb, keyword2cmyk: keyword2cmyk, keyword2lab: keyword2lab, keyword2xyz: keyword2xyz, xyz2rgb: xyz2rgb, xyz2lab: xyz2lab, xyz2lch: xyz2lch, lab2xyz: lab2xyz, lab2rgb: lab2rgb, lab2lch: lab2lch, lch2lab: lch2lab, lch2xyz: lch2xyz, lch2rgb: lch2rgb } function rgb2hsl(rgb) { var r = rgb[0]/255, g = rgb[1]/255, b = rgb[2]/255, min = Math.min(r, g, b), max = Math.max(r, g, b), delta = max - min, h, s, l; if (max == min) h = 0; else if (r == max) h = (g - b) / delta; else if (g == max) h = 2 + (b - r) / delta; else if (b == max) h = 4 + (r - g)/ delta; h = Math.min(h * 60, 360); if (h < 0) h += 360; l = (min + max) / 2; if (max == min) s = 0; else if (l <= 0.5) s = delta / (max + min); else s = delta / (2 - max - min); return [h, s * 100, l * 100]; } function rgb2hsv(rgb) { var r = rgb[0], g = rgb[1], b = rgb[2], min = Math.min(r, g, b), max = Math.max(r, g, b), delta = max - min, h, s, v; if (max == 0) s = 0; else s = (delta/max * 1000)/10; if (max == min) h = 0; else if (r == max) h = (g - b) / delta; else if (g == max) h = 2 + (b - r) / delta; else if (b == max) h = 4 + (r - g) / delta; h = Math.min(h * 60, 360); if (h < 0) h += 360; v = ((max / 255) * 1000) / 10; return [h, s, v]; } function rgb2hwb(rgb) { var r = rgb[0], g = rgb[1], b = rgb[2], h = rgb2hsl(rgb)[0], w = 1/255 * Math.min(r, Math.min(g, b)), b = 1 - 1/255 * Math.max(r, Math.max(g, b)); return [h, w * 100, b * 100]; } function rgb2cmyk(rgb) { var r = rgb[0] / 255, g = rgb[1] / 255, b = rgb[2] / 255, c, m, y, k; k = Math.min(1 - r, 1 - g, 1 - b); c = (1 - r - k) / (1 - k) || 0; m = (1 - g - k) / (1 - k) || 0; y = (1 - b - k) / (1 - k) || 0; return [c * 100, m * 100, y * 100, k * 100]; } function rgb2keyword(rgb) { return reverseKeywords[JSON.stringify(rgb)]; } function rgb2xyz(rgb) { var r = rgb[0] / 255, g = rgb[1] / 255, b = rgb[2] / 255; // assume sRGB r = r > 0.04045 ? Math.pow(((r + 0.055) / 1.055), 2.4) : (r / 12.92); g = g > 0.04045 ? Math.pow(((g + 0.055) / 1.055), 2.4) : (g / 12.92); b = b > 0.04045 ? Math.pow(((b + 0.055) / 1.055), 2.4) : (b / 12.92); var x = (r * 0.4124) + (g * 0.3576) + (b * 0.1805); var y = (r * 0.2126) + (g * 0.7152) + (b * 0.0722); var z = (r * 0.0193) + (g * 0.1192) + (b * 0.9505); return [x * 100, y *100, z * 100]; } function rgb2lab(rgb) { var xyz = rgb2xyz(rgb), x = xyz[0], y = xyz[1], z = xyz[2], l, a, b; x /= 95.047; y /= 100; z /= 108.883; x = x > 0.008856 ? Math.pow(x, 1/3) : (7.787 * x) + (16 / 116); y = y > 0.008856 ? Math.pow(y, 1/3) : (7.787 * y) + (16 / 116); z = z > 0.008856 ? Math.pow(z, 1/3) : (7.787 * z) + (16 / 116); l = (116 * y) - 16; a = 500 * (x - y); b = 200 * (y - z); return [l, a, b]; } function rgb2lch(args) { return lab2lch(rgb2lab(args)); } function hsl2rgb(hsl) { var h = hsl[0] / 360, s = hsl[1] / 100, l = hsl[2] / 100, t1, t2, t3, rgb, val; if (s == 0) { val = l * 255; return [val, val, val]; } if (l < 0.5) t2 = l * (1 + s); else t2 = l + s - l * s; t1 = 2 * l - t2; rgb = [0, 0, 0]; for (var i = 0; i < 3; i++) { t3 = h + 1 / 3 * - (i - 1); t3 < 0 && t3++; t3 > 1 && t3--; if (6 * t3 < 1) val = t1 + (t2 - t1) * 6 * t3; else if (2 * t3 < 1) val = t2; else if (3 * t3 < 2) val = t1 + (t2 - t1) * (2 / 3 - t3) * 6; else val = t1; rgb[i] = val * 255; } return rgb; } function hsl2hsv(hsl) { var h = hsl[0], s = hsl[1] / 100, l = hsl[2] / 100, sv, v; if(l === 0) { // no need to do calc on black // also avoids divide by 0 error return [0, 0, 0]; } l *= 2; s *= (l <= 1) ? l : 2 - l; v = (l + s) / 2; sv = (2 * s) / (l + s); return [h, sv * 100, v * 100]; } function hsl2hwb(args) { return rgb2hwb(hsl2rgb(args)); } function hsl2cmyk(args) { return rgb2cmyk(hsl2rgb(args)); } function hsl2keyword(args) { return rgb2keyword(hsl2rgb(args)); } function hsv2rgb(hsv) { var h = hsv[0] / 60, s = hsv[1] / 100, v = hsv[2] / 100, hi = Math.floor(h) % 6; var f = h - Math.floor(h), p = 255 * v * (1 - s), q = 255 * v * (1 - (s * f)), t = 255 * v * (1 - (s * (1 - f))), v = 255 * v; switch(hi) { case 0: return [v, t, p]; case 1: return [q, v, p]; case 2: return [p, v, t]; case 3: return [p, q, v]; case 4: return [t, p, v]; case 5: return [v, p, q]; } } function hsv2hsl(hsv) { var h = hsv[0], s = hsv[1] / 100, v = hsv[2] / 100, sl, l; l = (2 - s) * v; sl = s * v; sl /= (l <= 1) ? l : 2 - l; sl = sl || 0; l /= 2; return [h, sl * 100, l * 100]; } function hsv2hwb(args) { return rgb2hwb(hsv2rgb(args)) } function hsv2cmyk(args) { return rgb2cmyk(hsv2rgb(args)); } function hsv2keyword(args) { return rgb2keyword(hsv2rgb(args)); } // http://dev.w3.org/csswg/css-color/#hwb-to-rgb function hwb2rgb(hwb) { var h = hwb[0] / 360, wh = hwb[1] / 100, bl = hwb[2] / 100, ratio = wh + bl, i, v, f, n; // wh + bl cant be > 1 if (ratio > 1) { wh /= ratio; bl /= ratio; } i = Math.floor(6 * h); v = 1 - bl; f = 6 * h - i; if ((i & 0x01) != 0) { f = 1 - f; } n = wh + f * (v - wh); // linear interpolation switch (i) { default: case 6: case 0: r = v; g = n; b = wh; break; case 1: r = n; g = v; b = wh; break; case 2: r = wh; g = v; b = n; break; case 3: r = wh; g = n; b = v; break; case 4: r = n; g = wh; b = v; break; case 5: r = v; g = wh; b = n; break; } return [r * 255, g * 255, b * 255]; } function hwb2hsl(args) { return rgb2hsl(hwb2rgb(args)); } function hwb2hsv(args) { return rgb2hsv(hwb2rgb(args)); } function hwb2cmyk(args) { return rgb2cmyk(hwb2rgb(args)); } function hwb2keyword(args) { return rgb2keyword(hwb2rgb(args)); } function cmyk2rgb(cmyk) { var c = cmyk[0] / 100, m = cmyk[1] / 100, y = cmyk[2] / 100, k = cmyk[3] / 100, r, g, b; r = 1 - Math.min(1, c * (1 - k) + k); g = 1 - Math.min(1, m * (1 - k) + k); b = 1 - Math.min(1, y * (1 - k) + k); return [r * 255, g * 255, b * 255]; } function cmyk2hsl(args) { return rgb2hsl(cmyk2rgb(args)); } function cmyk2hsv(args) { return rgb2hsv(cmyk2rgb(args)); } function cmyk2hwb(args) { return rgb2hwb(cmyk2rgb(args)); } function cmyk2keyword(args) { return rgb2keyword(cmyk2rgb(args)); } function xyz2rgb(xyz) { var x = xyz[0] / 100, y = xyz[1] / 100, z = xyz[2] / 100, r, g, b; r = (x * 3.2406) + (y * -1.5372) + (z * -0.4986); g = (x * -0.9689) + (y * 1.8758) + (z * 0.0415); b = (x * 0.0557) + (y * -0.2040) + (z * 1.0570); // assume sRGB r = r > 0.0031308 ? ((1.055 * Math.pow(r, 1.0 / 2.4)) - 0.055) : r = (r * 12.92); g = g > 0.0031308 ? ((1.055 * Math.pow(g, 1.0 / 2.4)) - 0.055) : g = (g * 12.92); b = b > 0.0031308 ? ((1.055 * Math.pow(b, 1.0 / 2.4)) - 0.055) : b = (b * 12.92); r = Math.min(Math.max(0, r), 1); g = Math.min(Math.max(0, g), 1); b = Math.min(Math.max(0, b), 1); return [r * 255, g * 255, b * 255]; } function xyz2lab(xyz) { var x = xyz[0], y = xyz[1], z = xyz[2], l, a, b; x /= 95.047; y /= 100; z /= 108.883; x = x > 0.008856 ? Math.pow(x, 1/3) : (7.787 * x) + (16 / 116); y = y > 0.008856 ? Math.pow(y, 1/3) : (7.787 * y) + (16 / 116); z = z > 0.008856 ? Math.pow(z, 1/3) : (7.787 * z) + (16 / 116); l = (116 * y) - 16; a = 500 * (x - y); b = 200 * (y - z); return [l, a, b]; } function xyz2lch(args) { return lab2lch(xyz2lab(args)); } function lab2xyz(lab) { var l = lab[0], a = lab[1], b = lab[2], x, y, z, y2; if (l <= 8) { y = (l * 100) / 903.3; y2 = (7.787 * (y / 100)) + (16 / 116); } else { y = 100 * Math.pow((l + 16) / 116, 3); y2 = Math.pow(y / 100, 1/3); } x = x / 95.047 <= 0.008856 ? x = (95.047 * ((a / 500) + y2 - (16 / 116))) / 7.787 : 95.047 * Math.pow((a / 500) + y2, 3); z = z / 108.883 <= 0.008859 ? z = (108.883 * (y2 - (b / 200) - (16 / 116))) / 7.787 : 108.883 * Math.pow(y2 - (b / 200), 3); return [x, y, z]; } function lab2lch(lab) { var l = lab[0], a = lab[1], b = lab[2], hr, h, c; hr = Math.atan2(b, a); h = hr * 360 / 2 / Math.PI; if (h < 0) { h += 360; } c = Math.sqrt(a * a + b * b); return [l, c, h]; } function lab2rgb(args) { return xyz2rgb(lab2xyz(args)); } function lch2lab(lch) { var l = lch[0], c = lch[1], h = lch[2], a, b, hr; hr = h / 360 * 2 * Math.PI; a = c * Math.cos(hr); b = c * Math.sin(hr); return [l, a, b]; } function lch2xyz(args) { return lab2xyz(lch2lab(args)); } function lch2rgb(args) { return lab2rgb(lch2lab(args)); } function keyword2rgb(keyword) { return cssKeywords[keyword]; } function keyword2hsl(args) { return rgb2hsl(keyword2rgb(args)); } function keyword2hsv(args) { return rgb2hsv(keyword2rgb(args)); } function keyword2hwb(args) { return rgb2hwb(keyword2rgb(args)); } function keyword2cmyk(args) { return rgb2cmyk(keyword2rgb(args)); } function keyword2lab(args) { return rgb2lab(keyword2rgb(args)); } function keyword2xyz(args) { return rgb2xyz(keyword2rgb(args)); } var cssKeywords = { aliceblue: [240,248,255], antiquewhite: [250,235,215], aqua: [0,255,255], aquamarine: [127,255,212], azure: [240,255,255], beige: [245,245,220], bisque: [255,228,196], black: [0,0,0], blanchedalmond: [255,235,205], blue: [0,0,255], blueviolet: [138,43,226], brown: [165,42,42], burlywood: [222,184,135], cadetblue: [95,158,160], chartreuse: [127,255,0], chocolate: [210,105,30], coral: [255,127,80], cornflowerblue: [100,149,237], cornsilk: [255,248,220], crimson: [220,20,60], cyan: [0,255,255], darkblue: [0,0,139], darkcyan: [0,139,139], darkgoldenrod: [184,134,11], darkgray: [169,169,169], darkgreen: [0,100,0], darkgrey: [169,169,169], darkkhaki: [189,183,107], darkmagenta: [139,0,139], darkolivegreen: [85,107,47], darkorange: [255,140,0], darkorchid: [153,50,204], darkred: [139,0,0], darksalmon: [233,150,122], darkseagreen: [143,188,143], darkslateblue: [72,61,139], darkslategray: [47,79,79], darkslategrey: [47,79,79], darkturquoise: [0,206,209], darkviolet: [148,0,211], deeppink: [255,20,147], deepskyblue: [0,191,255], dimgray: [105,105,105], dimgrey: [105,105,105], dodgerblue: [30,144,255], firebrick: [178,34,34], floralwhite: [255,250,240], forestgreen: [34,139,34], fuchsia: [255,0,255], gainsboro: [220,220,220], ghostwhite: [248,248,255], gold: [255,215,0], goldenrod: [218,165,32], gray: [128,128,128], green: [0,128,0], greenyellow: [173,255,47], grey: [128,128,128], honeydew: [240,255,240], hotpink: [255,105,180], indianred: [205,92,92], indigo: [75,0,130], ivory: [255,255,240], khaki: [240,230,140], lavender: [230,230,250], lavenderblush: [255,240,245], lawngreen: [124,252,0], lemonchiffon: [255,250,205], lightblue: [173,216,230], lightcoral: [240,128,128], lightcyan: [224,255,255], lightgoldenrodyellow: [250,250,210], lightgray: [211,211,211], lightgreen: [144,238,144], lightgrey: [211,211,211], lightpink: [255,182,193], lightsalmon: [255,160,122], lightseagreen: [32,178,170], lightskyblue: [135,206,250], lightslategray: [119,136,153], lightslategrey: [119,136,153], lightsteelblue: [176,196,222], lightyellow: [255,255,224], lime: [0,255,0], limegreen: [50,205,50], linen: [250,240,230], magenta: [255,0,255], maroon: [128,0,0], mediumaquamarine: [102,205,170], mediumblue: [0,0,205], mediumorchid: [186,85,211], mediumpurple: [147,112,219], mediumseagreen: [60,179,113], mediumslateblue: [123,104,238], mediumspringgreen: [0,250,154], mediumturquoise: [72,209,204], mediumvioletred: [199,21,133], midnightblue: [25,25,112], mintcream: [245,255,250], mistyrose: [255,228,225], moccasin: [255,228,181], navajowhite: [255,222,173], navy: [0,0,128], oldlace: [253,245,230], olive: [128,128,0], olivedrab: [107,142,35], orange: [255,165,0], orangered: [255,69,0], orchid: [218,112,214], palegoldenrod: [238,232,170], palegreen: [152,251,152], paleturquoise: [175,238,238], palevioletred: [219,112,147], papayawhip: [255,239,213], peachpuff: [255,218,185], peru: [205,133,63], pink: [255,192,203], plum: [221,160,221], powderblue: [176,224,230], purple: [128,0,128], rebeccapurple: [102, 51, 153], red: [255,0,0], rosybrown: [188,143,143], royalblue: [65,105,225], saddlebrown: [139,69,19], salmon: [250,128,114], sandybrown: [244,164,96], seagreen: [46,139,87], seashell: [255,245,238], sienna: [160,82,45], silver: [192,192,192], skyblue: [135,206,235], slateblue: [106,90,205], slategray: [112,128,144], slategrey: [112,128,144], snow: [255,250,250], springgreen: [0,255,127], steelblue: [70,130,180], tan: [210,180,140], teal: [0,128,128], thistle: [216,191,216], tomato: [255,99,71], turquoise: [64,224,208], violet: [238,130,238], wheat: [245,222,179], white: [255,255,255], whitesmoke: [245,245,245], yellow: [255,255,0], yellowgreen: [154,205,50] }; var reverseKeywords = {}; for (var key in cssKeywords) { reverseKeywords[JSON.stringify(cssKeywords[key])] = key; } },{}],5:[function(require,module,exports){ var conversions = require("./conversions"); var convert = function() { return new Converter(); } for (var func in conversions) { // export Raw versions convert[func + "Raw"] = (function(func) { // accept array or plain args return function(arg) { if (typeof arg == "number") arg = Array.prototype.slice.call(arguments); return conversions[func](arg); } })(func); var pair = /(\w+)2(\w+)/.exec(func), from = pair[1], to = pair[2]; // export rgb2hsl and ["rgb"]["hsl"] convert[from] = convert[from] || {}; convert[from][to] = convert[func] = (function(func) { return function(arg) { if (typeof arg == "number") arg = Array.prototype.slice.call(arguments); var val = conversions[func](arg); if (typeof val == "string" || val === undefined) return val; // keyword for (var i = 0; i < val.length; i++) val[i] = Math.round(val[i]); return val; } })(func); } /* Converter does lazy conversion and caching */ var Converter = function() { this.convs = {}; }; /* Either get the values for a space or set the values for a space, depending on args */ Converter.prototype.routeSpace = function(space, args) { var values = args[0]; if (values === undefined) { // color.rgb() return this.getValues(space); } // color.rgb(10, 10, 10) if (typeof values == "number") { values = Array.prototype.slice.call(args); } return this.setValues(space, values); }; /* Set the values for a space, invalidating cache */ Converter.prototype.setValues = function(space, values) { this.space = space; this.convs = {}; this.convs[space] = values; return this; }; /* Get the values for a space. If there's already a conversion for the space, fetch it, otherwise compute it */ Converter.prototype.getValues = function(space) { var vals = this.convs[space]; if (!vals) { var fspace = this.space, from = this.convs[fspace]; vals = convert[fspace][space](from); this.convs[space] = vals; } return vals; }; ["rgb", "hsl", "hsv", "cmyk", "keyword"].forEach(function(space) { Converter.prototype[space] = function(vals) { return this.routeSpace(space, arguments); } }); module.exports = convert; },{"./conversions":4}],6:[function(require,module,exports){ module.exports = { "aliceblue": [240, 248, 255], "antiquewhite": [250, 235, 215], "aqua": [0, 255, 255], "aquamarine": [127, 255, 212], "azure": [240, 255, 255], "beige": [245, 245, 220], "bisque": [255, 228, 196], "black": [0, 0, 0], "blanchedalmond": [255, 235, 205], "blue": [0, 0, 255], "blueviolet": [138, 43, 226], "brown": [165, 42, 42], "burlywood": [222, 184, 135], "cadetblue": [95, 158, 160], "chartreuse": [127, 255, 0], "chocolate": [210, 105, 30], "coral": [255, 127, 80], "cornflowerblue": [100, 149, 237], "cornsilk": [255, 248, 220], "crimson": [220, 20, 60], "cyan": [0, 255, 255], "darkblue": [0, 0, 139], "darkcyan": [0, 139, 139], "darkgoldenrod": [184, 134, 11], "darkgray": [169, 169, 169], "darkgreen": [0, 100, 0], "darkgrey": [169, 169, 169], "darkkhaki": [189, 183, 107], "darkmagenta": [139, 0, 139], "darkolivegreen": [85, 107, 47], "darkorange": [255, 140, 0], "darkorchid": [153, 50, 204], "darkred": [139, 0, 0], "darksalmon": [233, 150, 122], "darkseagreen": [143, 188, 143], "darkslateblue": [72, 61, 139], "darkslategray": [47, 79, 79], "darkslategrey": [47, 79, 79], "darkturquoise": [0, 206, 209], "darkviolet": [148, 0, 211], "deeppink": [255, 20, 147], "deepskyblue": [0, 191, 255], "dimgray": [105, 105, 105], "dimgrey": [105, 105, 105], "dodgerblue": [30, 144, 255], "firebrick": [178, 34, 34], "floralwhite": [255, 250, 240], "forestgreen": [34, 139, 34], "fuchsia": [255, 0, 255], "gainsboro": [220, 220, 220], "ghostwhite": [248, 248, 255], "gold": [255, 215, 0], "goldenrod": [218, 165, 32], "gray": [128, 128, 128], "green": [0, 128, 0], "greenyellow": [173, 255, 47], "grey": [128, 128, 128], "honeydew": [240, 255, 240], "hotpink": [255, 105, 180], "indianred": [205, 92, 92], "indigo": [75, 0, 130], "ivory": [255, 255, 240], "khaki": [240, 230, 140], "lavender": [230, 230, 250], "lavenderblush": [255, 240, 245], "lawngreen": [124, 252, 0], "lemonchiffon": [255, 250, 205], "lightblue": [173, 216, 230], "lightcoral": [240, 128, 128], "lightcyan": [224, 255, 255], "lightgoldenrodyellow": [250, 250, 210], "lightgray": [211, 211, 211], "lightgreen": [144, 238, 144], "lightgrey": [211, 211, 211], "lightpink": [255, 182, 193], "lightsalmon": [255, 160, 122], "lightseagreen": [32, 178, 170], "lightskyblue": [135, 206, 250], "lightslategray": [119, 136, 153], "lightslategrey": [119, 136, 153], "lightsteelblue": [176, 196, 222], "lightyellow": [255, 255, 224], "lime": [0, 255, 0], "limegreen": [50, 205, 50], "linen": [250, 240, 230], "magenta": [255, 0, 255], "maroon": [128, 0, 0], "mediumaquamarine": [102, 205, 170], "mediumblue": [0, 0, 205], "mediumorchid": [186, 85, 211], "mediumpurple": [147, 112, 219], "mediumseagreen": [60, 179, 113], "mediumslateblue": [123, 104, 238], "mediumspringgreen": [0, 250, 154], "mediumturquoise": [72, 209, 204], "mediumvioletred": [199, 21, 133], "midnightblue": [25, 25, 112], "mintcream": [245, 255, 250], "mistyrose": [255, 228, 225], "moccasin": [255, 228, 181], "navajowhite": [255, 222, 173], "navy": [0, 0, 128], "oldlace": [253, 245, 230], "olive": [128, 128, 0], "olivedrab": [107, 142, 35], "orange": [255, 165, 0], "orangered": [255, 69, 0], "orchid": [218, 112, 214], "palegoldenrod": [238, 232, 170], "palegreen": [152, 251, 152], "paleturquoise": [175, 238, 238], "palevioletred": [219, 112, 147], "papayawhip": [255, 239, 213], "peachpuff": [255, 218, 185], "peru": [205, 133, 63], "pink": [255, 192, 203], "plum": [221, 160, 221], "powderblue": [176, 224, 230], "purple": [128, 0, 128], "rebeccapurple": [102, 51, 153], "red": [255, 0, 0], "rosybrown": [188, 143, 143], "royalblue": [65, 105, 225], "saddlebrown": [139, 69, 19], "salmon": [250, 128, 114], "sandybrown": [244, 164, 96], "seagreen": [46, 139, 87], "seashell": [255, 245, 238], "sienna": [160, 82, 45], "silver": [192, 192, 192], "skyblue": [135, 206, 235], "slateblue": [106, 90, 205], "slategray": [112, 128, 144], "slategrey": [112, 128, 144], "snow": [255, 250, 250], "springgreen": [0, 255, 127], "steelblue": [70, 130, 180], "tan": [210, 180, 140], "teal": [0, 128, 128], "thistle": [216, 191, 216], "tomato": [255, 99, 71], "turquoise": [64, 224, 208], "violet": [238, 130, 238], "wheat": [245, 222, 179], "white": [255, 255, 255], "whitesmoke": [245, 245, 245], "yellow": [255, 255, 0], "yellowgreen": [154, 205, 50] }; },{}],7:[function(require,module,exports){ var Chart = require('./core/core.js')(); require('./core/core.helpers')(Chart); require('./core/core.element')(Chart); require('./core/core.animation')(Chart); require('./core/core.controller')(Chart); require('./core/core.datasetController')(Chart); require('./core/core.layoutService')(Chart); require('./core/core.legend')(Chart); require('./core/core.plugin.js')(Chart); require('./core/core.scale')(Chart); require('./core/core.scaleService')(Chart); require('./core/core.title')(Chart); require('./core/core.tooltip')(Chart); require('./controllers/controller.bar')(Chart); require('./controllers/controller.bubble')(Chart); require('./controllers/controller.doughnut')(Chart); require('./controllers/controller.line')(Chart); require('./controllers/controller.polarArea')(Chart); require('./controllers/controller.radar')(Chart); require('./scales/scale.category')(Chart); require('./scales/scale.linear')(Chart); require('./scales/scale.logarithmic')(Chart); require('./scales/scale.radialLinear')(Chart); require('./scales/scale.time')(Chart); require('./elements/element.arc')(Chart); require('./elements/element.line')(Chart); require('./elements/element.point')(Chart); require('./elements/element.rectangle')(Chart); require('./charts/Chart.Bar')(Chart); require('./charts/Chart.Bubble')(Chart); require('./charts/Chart.Doughnut')(Chart); require('./charts/Chart.Line')(Chart); require('./charts/Chart.PolarArea')(Chart); require('./charts/Chart.Radar')(Chart); require('./charts/Chart.Scatter')(Chart); window.Chart = module.exports = Chart; },{"./charts/Chart.Bar":8,"./charts/Chart.Bubble":9,"./charts/Chart.Doughnut":10,"./charts/Chart.Line":11,"./charts/Chart.PolarArea":12,"./charts/Chart.Radar":13,"./charts/Chart.Scatter":14,"./controllers/controller.bar":15,"./controllers/controller.bubble":16,"./controllers/controller.doughnut":17,"./controllers/controller.line":18,"./controllers/controller.polarArea":19,"./controllers/controller.radar":20,"./core/core.animation":21,"./core/core.controller":22,"./core/core.datasetController":23,"./core/core.element":24,"./core/core.helpers":25,"./core/core.js":26,"./core/core.layoutService":27,"./core/core.legend":28,"./core/core.plugin.js":29,"./core/core.scale":30,"./core/core.scaleService":31,"./core/core.title":32,"./core/core.tooltip":33,"./elements/element.arc":34,"./elements/element.line":35,"./elements/element.point":36,"./elements/element.rectangle":37,"./scales/scale.category":38,"./scales/scale.linear":39,"./scales/scale.logarithmic":40,"./scales/scale.radialLinear":41,"./scales/scale.time":42}],8:[function(require,module,exports){ "use strict"; module.exports = function(Chart) { Chart.Bar = function(context, config) { config.type = 'bar'; return new Chart(context, config); }; }; },{}],9:[function(require,module,exports){ "use strict"; module.exports = function(Chart) { Chart.Bubble = function(context, config) { config.type = 'bubble'; return new Chart(context, config); }; }; },{}],10:[function(require,module,exports){ "use strict"; module.exports = function(Chart) { Chart.Doughnut = function(context, config) { config.type = 'doughnut'; return new Chart(context, config); }; }; },{}],11:[function(require,module,exports){ "use strict"; module.exports = function(Chart) { Chart.Line = function(context, config) { config.type = 'line'; return new Chart(context, config); }; }; },{}],12:[function(require,module,exports){ "use strict"; module.exports = function(Chart) { Chart.PolarArea = function(context, config) { config.type = 'polarArea'; return new Chart(context, config); }; }; },{}],13:[function(require,module,exports){ "use strict"; module.exports = function(Chart) { var helpers = Chart.helpers; var defaultConfig = { aspectRatio: 1 }; Chart.Radar = function(context, config) { config.options = helpers.configMerge(defaultConfig, config.options); config.type = 'radar'; return new Chart(context, config); }; }; },{}],14:[function(require,module,exports){ "use strict"; module.exports = function(Chart) { var defaultConfig = { hover: { mode: 'single' }, scales: { xAxes: [{ type: "linear", // scatter should not use a category axis position: "bottom", id: "x-axis-1" // need an ID so datasets can reference the scale }], yAxes: [{ type: "linear", position: "left", id: "y-axis-1" }] }, tooltips: { callbacks: { title: function(tooltipItems, data) { // Title doesn't make sense for scatter since we format the data as a point return ''; }, label: function(tooltipItem, data) { return '(' + tooltipItem.xLabel + ', ' + tooltipItem.yLabel + ')'; } } } }; // Register the default config for this type Chart.defaults.scatter = defaultConfig; // Scatter charts use line controllers Chart.controllers.scatter = Chart.controllers.line; Chart.Scatter = function(context, config) { config.type = 'scatter'; return new Chart(context, config); }; }; },{}],15:[function(require,module,exports){ "use strict"; module.exports = function(Chart) { var helpers = Chart.helpers; Chart.defaults.bar = { hover: { mode: "label" }, scales: { xAxes: [{ type: "category", // Specific to Bar Controller categoryPercentage: 0.8, barPercentage: 0.9, // grid line settings gridLines: { offsetGridLines: true } }], yAxes: [{ type: "linear" }] } }; Chart.controllers.bar = Chart.DatasetController.extend({ initialize: function(chart, datasetIndex) { Chart.DatasetController.prototype.initialize.call(this, chart, datasetIndex); // Use this to indicate that this is a bar dataset. this.getMeta().bar = true; }, // Get the number of datasets that display bars. We use this to correctly calculate the bar width getBarCount: function getBarCount() { var barCount = 0; helpers.each(this.chart.data.datasets, function(dataset, datasetIndex) { var meta = this.chart.getDatasetMeta(datasetIndex); if (meta.bar && this.chart.isDatasetVisible(datasetIndex)) { ++barCount; } }, this); return barCount; }, addElements: function() { var meta = this.getMeta(); helpers.each(this.getDataset().data, function(value, index) { meta.data[index] = meta.data[index] || new Chart.elements.Rectangle({ _chart: this.chart.chart, _datasetIndex: this.index, _index: index }); }, this); }, addElementAndReset: function(index) { var rectangle = new Chart.elements.Rectangle({ _chart: this.chart.chart, _datasetIndex: this.index, _index: index }); var numBars = this.getBarCount(); // Add to the points array and reset it this.getMeta().data.splice(index, 0, rectangle); this.updateElement(rectangle, index, true, numBars); }, update: function update(reset) { var numBars = this.getBarCount(); helpers.each(this.getMeta().data, function(rectangle, index) { this.updateElement(rectangle, index, reset, numBars); }, this); }, updateElement: function updateElement(rectangle, index, reset, numBars) { var meta = this.getMeta(); var xScale = this.getScaleForId(meta.xAxisID); var yScale = this.getScaleForId(meta.yAxisID); var yScalePoint; if (yScale.min < 0 && yScale.max < 0) { // all less than 0. use the top yScalePoint = yScale.getPixelForValue(yScale.max); } else if (yScale.min > 0 && yScale.max > 0) { yScalePoint = yScale.getPixelForValue(yScale.min); } else { yScalePoint = yScale.getPixelForValue(0); } helpers.extend(rectangle, { // Utility _chart: this.chart.chart, _xScale: xScale, _yScale: yScale, _datasetIndex: this.index, _index: index, // Desired view properties _model: { x: this.calculateBarX(index, this.index), y: reset ? yScalePoint : this.calculateBarY(index, this.index), // Tooltip label: this.chart.data.labels[index], datasetLabel: this.getDataset().label, // Appearance base: reset ? yScalePoint : this.calculateBarBase(this.index, index), width: this.calculateBarWidth(numBars), backgroundColor: rectangle.custom && rectangle.custom.backgroundColor ? rectangle.custom.backgroundColor : helpers.getValueAtIndexOrDefault(this.getDataset().backgroundColor, index, this.chart.options.elements.rectangle.backgroundColor), borderSkipped: rectangle.custom && rectangle.custom.borderSkipped ? rectangle.custom.borderSkipped : this.chart.options.elements.rectangle.borderSkipped, borderColor: rectangle.custom && rectangle.custom.borderColor ? rectangle.custom.borderColor : helpers.getValueAtIndexOrDefault(this.getDataset().borderColor, index, this.chart.options.elements.rectangle.borderColor), borderWidth: rectangle.custom && rectangle.custom.borderWidth ? rectangle.custom.borderWidth : helpers.getValueAtIndexOrDefault(this.getDataset().borderWidth, index, this.chart.options.elements.rectangle.borderWidth) } }); rectangle.pivot(); }, calculateBarBase: function(datasetIndex, index) { var meta = this.getMeta(); var xScale = this.getScaleForId(meta.xAxisID); var yScale = this.getScaleForId(meta.yAxisID); var base = 0; if (yScale.options.stacked) { var value = this.chart.data.datasets[datasetIndex].data[index]; if (value < 0) { for (var i = 0; i < datasetIndex; i++) { var negDS = this.chart.data.datasets[i]; var negDSMeta = this.chart.getDatasetMeta(i); if (negDSMeta.bar && negDSMeta.yAxisID === yScale.id && this.chart.isDatasetVisible(i)) { base += negDS.data[index] < 0 ? negDS.data[index] : 0; } } } else { for (var j = 0; j < datasetIndex; j++) { var posDS = this.chart.data.datasets[j]; var posDSMeta = this.chart.getDatasetMeta(j); if (posDSMeta.bar && posDSMeta.yAxisID === yScale.id && this.chart.isDatasetVisible(j)) { base += posDS.data[index] > 0 ? posDS.data[index] : 0; } } } return yScale.getPixelForValue(base); } base = yScale.getPixelForValue(yScale.min); if (yScale.beginAtZero || ((yScale.min <= 0 && yScale.max >= 0) || (yScale.min >= 0 && yScale.max <= 0))) { base = yScale.getPixelForValue(0, 0); //base += yScale.options.gridLines.lineWidth; } else if (yScale.min < 0 && yScale.max < 0) { // All values are negative. Use the top as the base base = yScale.getPixelForValue(yScale.max); } return base; }, getRuler: function() { var meta = this.getMeta(); var xScale = this.getScaleForId(meta.xAxisID); var yScale = this.getScaleForId(meta.yAxisID); var datasetCount = this.getBarCount(); var tickWidth = (function() { var min = xScale.getPixelForTick(1) - xScale.getPixelForTick(0); for (var i = 2; i < xScale.ticks.length; i++) { min = Math.min(xScale.getPixelForTick(i) - xScale.getPixelForTick(i - 1), min); } return min; }).call(this); var categoryWidth = tickWidth * xScale.options.categoryPercentage; var categorySpacing = (tickWidth - (tickWidth * xScale.options.categoryPercentage)) / 2; var fullBarWidth = categoryWidth / datasetCount; if (xScale.ticks.length !== this.chart.data.labels.length) { var perc = xScale.ticks.length / this.chart.data.labels.length; fullBarWidth = fullBarWidth * perc; } var barWidth = fullBarWidth * xScale.options.barPercentage; var barSpacing = fullBarWidth - (fullBarWidth * xScale.options.barPercentage); return { datasetCount: datasetCount, tickWidth: tickWidth, categoryWidth: categoryWidth, categorySpacing: categorySpacing, fullBarWidth: fullBarWidth, barWidth: barWidth, barSpacing: barSpacing }; }, calculateBarWidth: function() { var xScale = this.getScaleForId(this.getMeta().xAxisID); var ruler = this.getRuler(); return xScale.options.stacked ? ruler.categoryWidth : ruler.barWidth; }, // Get bar index from the given dataset index accounting for the fact that not all bars are visible getBarIndex: function(datasetIndex) { var barIndex = 0; var meta, j; for (j = 0; j < datasetIndex; ++j) { meta = this.chart.getDatasetMeta(j); if (meta.bar && this.chart.isDatasetVisible(j)) { ++barIndex; } } return barIndex; }, calculateBarX: function(index, datasetIndex) { var meta = this.getMeta(); var yScale = this.getScaleForId(meta.yAxisID); var xScale = this.getScaleForId(meta.xAxisID); var barIndex = this.getBarIndex(datasetIndex); var ruler = this.getRuler(); var leftTick = xScale.getPixelForValue(null, index, datasetIndex, this.chart.isCombo); leftTick -= this.chart.isCombo ? (ruler.tickWidth / 2) : 0; if (xScale.options.stacked) { return leftTick + (ruler.categoryWidth / 2) + ruler.categorySpacing; } return leftTick + (ruler.barWidth / 2) + ruler.categorySpacing + (ruler.barWidth * barIndex) + (ruler.barSpacing / 2) + (ruler.barSpacing * barIndex); }, calculateBarY: function(index, datasetIndex) { var meta = this.getMeta(); var xScale = this.getScaleForId(meta.xAxisID); var yScale = this.getScaleForId(meta.yAxisID); var value = this.getDataset().data[index]; if (yScale.options.stacked) { var sumPos = 0, sumNeg = 0; for (var i = 0; i < datasetIndex; i++) { var ds = this.chart.data.datasets[i]; var dsMeta = this.chart.getDatasetMeta(i); if (dsMeta.bar && dsMeta.yAxisID === yScale.id && this.chart.isDatasetVisible(i)) { if (ds.data[index] < 0) { sumNeg += ds.data[index] || 0; } else { sumPos += ds.data[index] || 0; } } } if (value < 0) { return yScale.getPixelForValue(sumNeg + value); } else { return yScale.getPixelForValue(sumPos + value); } } return yScale.getPixelForValue(value); }, draw: function(ease) { var easingDecimal = ease || 1; helpers.each(this.getMeta().data, function(rectangle, index) { var d = this.getDataset().data[index]; if (d !== null && d !== undefined && !isNaN(d)) { rectangle.transition(easingDecimal).draw(); } }, this); }, setHoverStyle: function(rectangle) { var dataset = this.chart.data.datasets[rectangle._datasetIndex]; var index = rectangle._index; rectangle._model.backgroundColor = rectangle.custom && rectangle.custom.hoverBackgroundColor ? rectangle.custom.hoverBackgroundColor : helpers.getValueAtIndexOrDefault(dataset.hoverBackgroundColor, index, helpers.color(rectangle._model.backgroundColor).saturate(0.5).darken(0.1).rgbString()); rectangle._model.borderColor = rectangle.custom && rectangle.custom.hoverBorderColor ? rectangle.custom.hoverBorderColor : helpers.getValueAtIndexOrDefault(dataset.hoverBorderColor, index, helpers.color(rectangle._model.borderColor).saturate(0.5).darken(0.1).rgbString()); rectangle._model.borderWidth = rectangle.custom && rectangle.custom.hoverBorderWidth ? rectangle.custom.hoverBorderWidth : helpers.getValueAtIndexOrDefault(dataset.hoverBorderWidth, index, rectangle._model.borderWidth); }, removeHoverStyle: function(rectangle) { var dataset = this.chart.data.datasets[rectangle._datasetIndex]; var index = rectangle._index; rectangle._model.backgroundColor = rectangle.custom && rectangle.custom.backgroundColor ? rectangle.custom.backgroundColor : helpers.getValueAtIndexOrDefault(this.getDataset().backgroundColor, index, this.chart.options.elements.rectangle.backgroundColor); rectangle._model.borderColor = rectangle.custom && rectangle.custom.borderColor ? rectangle.custom.borderColor : helpers.getValueAtIndexOrDefault(this.getDataset().borderColor, index, this.chart.options.elements.rectangle.borderColor); rectangle._model.borderWidth = rectangle.custom && rectangle.custom.borderWidth ? rectangle.custom.borderWidth : helpers.getValueAtIndexOrDefault(this.getDataset().borderWidth, index, this.chart.options.elements.rectangle.borderWidth); } }); // including horizontalBar in the bar file, instead of a file of its own // it extends bar (like pie extends doughnut) Chart.defaults.horizontalBar = { hover: { mode: "label" }, scales: { xAxes: [{ type: "linear", position: "bottom" }], yAxes: [{ position: "left", type: "category", // Specific to Horizontal Bar Controller categoryPercentage: 0.8, barPercentage: 0.9, // grid line settings gridLines: { offsetGridLines: true } }] }, }; Chart.controllers.horizontalBar = Chart.controllers.bar.extend({ updateElement: function updateElement(rectangle, index, reset, numBars) { var meta = this.getMeta(); var xScale = this.getScaleForId(meta.xAxisID); var yScale = this.getScaleForId(meta.yAxisID); var xScalePoint; if (xScale.min < 0 && xScale.max < 0) { // all less than 0. use the right xScalePoint = xScale.getPixelForValue(xScale.max); } else if (xScale.min > 0 && xScale.max > 0) { xScalePoint = xScale.getPixelForValue(xScale.min); } else { xScalePoint = xScale.getPixelForValue(0); } helpers.extend(rectangle, { // Utility _chart: this.chart.chart, _xScale: xScale, _yScale: yScale, _datasetIndex: this.index, _index: index, // Desired view properties _model: { x: reset ? xScalePoint : this.calculateBarX(index, this.index), y: this.calculateBarY(index, this.index), // Tooltip label: this.chart.data.labels[index], datasetLabel: this.getDataset().label, // Appearance base: reset ? xScalePoint : this.calculateBarBase(this.index, index), height: this.calculateBarHeight(numBars), backgroundColor: rectangle.custom && rectangle.custom.backgroundColor ? rectangle.custom.backgroundColor : helpers.getValueAtIndexOrDefault(this.getDataset().backgroundColor, index, this.chart.options.elements.rectangle.backgroundColor), borderSkipped: rectangle.custom && rectangle.custom.borderSkipped ? rectangle.custom.borderSkipped : this.chart.options.elements.rectangle.borderSkipped, borderColor: rectangle.custom && rectangle.custom.borderColor ? rectangle.custom.borderColor : helpers.getValueAtIndexOrDefault(this.getDataset().borderColor, index, this.chart.options.elements.rectangle.borderColor), borderWidth: rectangle.custom && rectangle.custom.borderWidth ? rectangle.custom.borderWidth : helpers.getValueAtIndexOrDefault(this.getDataset().borderWidth, index, this.chart.options.elements.rectangle.borderWidth) }, draw: function () { var ctx = this._chart.ctx; var vm = this._view; var halfHeight = vm.height / 2, topY = vm.y - halfHeight, bottomY = vm.y + halfHeight, right = vm.base - (vm.base - vm.x), halfStroke = vm.borderWidth / 2; // Canvas doesn't allow us to stroke inside the width so we can // adjust the sizes to fit if we're setting a stroke on the line if (vm.borderWidth) { topY += halfStroke; bottomY -= halfStroke; right += halfStroke; } ctx.beginPath(); ctx.fillStyle = vm.backgroundColor; ctx.strokeStyle = vm.borderColor; ctx.lineWidth = vm.borderWidth; // Corner points, from bottom-left to bottom-right clockwise // | 1 2 | // | 0 3 | var corners = [ [vm.base, bottomY], [vm.base, topY], [right, topY], [right, bottomY] ]; // Find first (starting) corner with fallback to 'bottom' var borders = ['bottom', 'left', 'top', 'right']; var startCorner = borders.indexOf(vm.borderSkipped, 0); if (startCorner === -1) startCorner = 0; function cornerAt(index) { return corners[(startCorner + index) % 4]; } // Draw rectangle from 'startCorner' ctx.moveTo.apply(ctx, cornerAt(0)); for (var i = 1; i < 4; i++) ctx.lineTo.apply(ctx, cornerAt(i)); ctx.fill(); if (vm.borderWidth) { ctx.stroke(); } }, inRange: function (mouseX, mouseY) { var vm = this._view; var inRange = false; if (vm) { if (vm.x < vm.base) { inRange = (mouseY >= vm.y - vm.height / 2 && mouseY <= vm.y + vm.height / 2) && (mouseX >= vm.x && mouseX <= vm.base); } else { inRange = (mouseY >= vm.y - vm.height / 2 && mouseY <= vm.y + vm.height / 2) && (mouseX >= vm.base && mouseX <= vm.x); } } return inRange; } }); rectangle.pivot(); }, calculateBarBase: function (datasetIndex, index) { var meta = this.getMeta(); var xScale = this.getScaleForId(meta.xAxisID); var yScale = this.getScaleForId(meta.yAxisID); var base = 0; if (xScale.options.stacked) { var value = this.chart.data.datasets[datasetIndex].data[index]; if (value < 0) { for (var i = 0; i < datasetIndex; i++) { var negDS = this.chart.data.datasets[i]; var negDSMeta = this.chart.getDatasetMeta(i); if (negDSMeta.bar && negDSMeta.xAxisID === xScale.id && this.chart.isDatasetVisible(i)) { base += negDS.data[index] < 0 ? negDS.data[index] : 0; } } } else { for (var j = 0; j < datasetIndex; j++) { var posDS = this.chart.data.datasets[j]; var posDSMeta = this.chart.getDatasetMeta(j); if (posDSMeta.bar && posDSMeta.xAxisID === xScale.id && this.chart.isDatasetVisible(j)) { base += posDS.data[index] > 0 ? posDS.data[index] : 0; } } } return xScale.getPixelForValue(base); } base = xScale.getPixelForValue(xScale.min); if (xScale.beginAtZero || ((xScale.min <= 0 && xScale.max >= 0) || (xScale.min >= 0 && xScale.max <= 0))) { base = xScale.getPixelForValue(0, 0); } else if (xScale.min < 0 && xScale.max < 0) { // All values are negative. Use the right as the base base = xScale.getPixelForValue(xScale.max); } return base; }, getRuler: function () { var meta = this.getMeta(); var xScale = this.getScaleForId(meta.xAxisID); var yScale = this.getScaleForId(meta.yAxisID); var datasetCount = this.getBarCount(); var tickHeight = (function () { var min = yScale.getPixelForTick(1) - yScale.getPixelForTick(0); for (var i = 2; i < this.getDataset().data.length; i++) { min = Math.min(yScale.getPixelForTick(i) - yScale.getPixelForTick(i - 1), min); } return min; }).call(this); var categoryHeight = tickHeight * yScale.options.categoryPercentage; var categorySpacing = (tickHeight - (tickHeight * yScale.options.categoryPercentage)) / 2; var fullBarHeight = categoryHeight / datasetCount; if (yScale.ticks.length !== this.chart.data.labels.length) { var perc = yScale.ticks.length / this.chart.data.labels.length; fullBarHeight = fullBarHeight * perc; } var barHeight = fullBarHeight * yScale.options.barPercentage; var barSpacing = fullBarHeight - (fullBarHeight * yScale.options.barPercentage); return { datasetCount: datasetCount, tickHeight: tickHeight, categoryHeight: categoryHeight, categorySpacing: categorySpacing, fullBarHeight: fullBarHeight, barHeight: barHeight, barSpacing: barSpacing, }; }, calculateBarHeight: function () { var yScale = this.getScaleForId(this.getMeta().yAxisID); var ruler = this.getRuler(); return yScale.options.stacked ? ruler.categoryHeight : ruler.barHeight; }, calculateBarX: function (index, datasetIndex) { var meta = this.getMeta(); var xScale = this.getScaleForId(meta.xAxisID); var yScale = this.getScaleForId(meta.yAxisID); var value = this.getDataset().data[index]; if (xScale.options.stacked) { var sumPos = 0, sumNeg = 0; for (var i = 0; i < datasetIndex; i++) { var ds = this.chart.data.datasets[i]; var dsMeta = this.chart.getDatasetMeta(i); if (dsMeta.bar && dsMeta.xAxisID === xScale.id && this.chart.isDatasetVisible(i)) { if (ds.data[index] < 0) { sumNeg += ds.data[index] || 0; } else { sumPos += ds.data[index] || 0; } } } if (value < 0) { return xScale.getPixelForValue(sumNeg + value); } else { return xScale.getPixelForValue(sumPos + value); } } return xScale.getPixelForValue(value); }, calculateBarY: function (index, datasetIndex) { var meta = this.getMeta(); var yScale = this.getScaleForId(meta.yAxisID); var xScale = this.getScaleForId(meta.xAxisID); var barIndex = this.getBarIndex(datasetIndex); var ruler = this.getRuler(); var topTick = yScale.getPixelForValue(null, index, datasetIndex, this.chart.isCombo); topTick -= this.chart.isCombo ? (ruler.tickHeight / 2) : 0; if (yScale.options.stacked) { return topTick + (ruler.categoryHeight / 2) + ruler.categorySpacing; } return topTick + (ruler.barHeight / 2) + ruler.categorySpacing + (ruler.barHeight * barIndex) + (ruler.barSpacing / 2) + (ruler.barSpacing * barIndex); } }); }; },{}],16:[function(require,module,exports){ "use strict"; module.exports = function(Chart) { var helpers = Chart.helpers; Chart.defaults.bubble = { hover: { mode: "single" }, scales: { xAxes: [{ type: "linear", // bubble should probably use a linear scale by default position: "bottom", id: "x-axis-0" // need an ID so datasets can reference the scale }], yAxes: [{ type: "linear", position: "left", id: "y-axis-0" }] }, tooltips: { callbacks: { title: function(tooltipItems, data) { // Title doesn't make sense for scatter since we format the data as a point return ''; }, label: function(tooltipItem, data) { var datasetLabel = data.datasets[tooltipItem.datasetIndex].label || ''; var dataPoint = data.datasets[tooltipItem.datasetIndex].data[tooltipItem.index]; return datasetLabel + ': (' + dataPoint.x + ', ' + dataPoint.y + ', ' + dataPoint.r + ')'; } } } }; Chart.controllers.bubble = Chart.DatasetController.extend({ addElements: function() { var meta = this.getMeta(); helpers.each(this.getDataset().data, function(value, index) { meta.data[index] = meta.data[index] || new Chart.elements.Point({ _chart: this.chart.chart, _datasetIndex: this.index, _index: index }); }, this); }, addElementAndReset: function(index) { var point = new Chart.elements.Point({ _chart: this.chart.chart, _datasetIndex: this.index, _index: index }); // Add to the points array and reset it this.getMeta().data.splice(index, 0, point); this.updateElement(point, index, true); }, update: function update(reset) { var meta = this.getMeta(); var points = meta.data; var yScale = this.getScaleForId(meta.yAxisID); var xScale = this.getScaleForId(meta.xAxisID); var scaleBase; if (yScale.min < 0 && yScale.max < 0) { scaleBase = yScale.getPixelForValue(yScale.max); } else if (yScale.min > 0 && yScale.max > 0) { scaleBase = yScale.getPixelForValue(yScale.min); } else { scaleBase = yScale.getPixelForValue(0); } // Update Points helpers.each(points, function(point, index) { this.updateElement(point, index, reset); }, this); }, updateElement: function(point, index, reset) { var meta = this.getMeta(); var yScale = this.getScaleForId(meta.yAxisID); var xScale = this.getScaleForId(meta.xAxisID); var scaleBase; if (yScale.min < 0 && yScale.max < 0) { scaleBase = yScale.getPixelForValue(yScale.max); } else if (yScale.min > 0 && yScale.max > 0) { scaleBase = yScale.getPixelForValue(yScale.min); } else { scaleBase = yScale.getPixelForValue(0); } helpers.extend(point, { // Utility _chart: this.chart.chart, _xScale: xScale, _yScale: yScale, _datasetIndex: this.index, _index: index, // Desired view properties _model: { x: reset ? xScale.getPixelForDecimal(0.5) : xScale.getPixelForValue(this.getDataset().data[index], index, this.index, this.chart.isCombo), y: reset ? scaleBase : yScale.getPixelForValue(this.getDataset().data[index], index, this.index), // Appearance radius: reset ? 0 : point.custom && point.custom.radius ? point.custom.radius : this.getRadius(this.getDataset().data[index]), backgroundColor: point.custom && point.custom.backgroundColor ? point.custom.backgroundColor : helpers.getValueAtIndexOrDefault(this.getDataset().backgroundColor, index, this.chart.options.elements.point.backgroundColor), borderColor: point.custom && point.custom.borderColor ? point.custom.borderColor : helpers.getValueAtIndexOrDefault(this.getDataset().borderColor, index, this.chart.options.elements.point.borderColor), borderWidth: point.custom && point.custom.borderWidth ? point.custom.borderWidth : helpers.getValueAtIndexOrDefault(this.getDataset().borderWidth, index, this.chart.options.elements.point.borderWidth), // Tooltip hitRadius: point.custom && point.custom.hitRadius ? point.custom.hitRadius : helpers.getValueAtIndexOrDefault(this.getDataset().hitRadius, index, this.chart.options.elements.point.hitRadius) } }); point._model.skip = point.custom && point.custom.skip ? point.custom.skip : (isNaN(point._model.x) || isNaN(point._model.y)); point.pivot(); }, getRadius: function(value) { return value.r || this.chart.options.elements.point.radius; }, draw: function(ease) { var easingDecimal = ease || 1; // Transition and Draw the Points helpers.each(this.getMeta().data, function(point, index) { point.transition(easingDecimal); point.draw(); }); }, setHoverStyle: function(point) { // Point var dataset = this.chart.data.datasets[point._datasetIndex]; var index = point._index; point._model.radius = point.custom && point.custom.hoverRadius ? point.custom.hoverRadius : (helpers.getValueAtIndexOrDefault(dataset.hoverRadius, index, this.chart.options.elements.point.hoverRadius)) + this.getRadius(this.getDataset().data[point._index]); point._model.backgroundColor = point.custom && point.custom.hoverBackgroundColor ? point.custom.hoverBackgroundColor : helpers.getValueAtIndexOrDefault(dataset.hoverBackgroundColor, index, helpers.color(point._model.backgroundColor).saturate(0.5).darken(0.1).rgbString()); point._model.borderColor = point.custom && point.custom.hoverBorderColor ? point.custom.hoverBorderColor : helpers.getValueAtIndexOrDefault(dataset.hoverBorderColor, index, helpers.color(point._model.borderColor).saturate(0.5).darken(0.1).rgbString()); point._model.borderWidth = point.custom && point.custom.hoverBorderWidth ? point.custom.hoverBorderWidth : helpers.getValueAtIndexOrDefault(dataset.hoverBorderWidth, index, point._model.borderWidth); }, removeHoverStyle: function(point) { var dataset = this.chart.data.datasets[point._datasetIndex]; var index = point._index; point._model.radius = point.custom && point.custom.radius ? point.custom.radius : this.getRadius(this.getDataset().data[point._index]); point._model.backgroundColor = point.custom && point.custom.backgroundColor ? point.custom.backgroundColor : helpers.getValueAtIndexOrDefault(this.getDataset().backgroundColor, index, this.chart.options.elements.point.backgroundColor); point._model.borderColor = point.custom && point.custom.borderColor ? point.custom.borderColor : helpers.getValueAtIndexOrDefault(this.getDataset().borderColor, index, this.chart.options.elements.point.borderColor); point._model.borderWidth = point.custom && point.custom.borderWidth ? point.custom.borderWidth : helpers.getValueAtIndexOrDefault(this.getDataset().borderWidth, index, this.chart.options.elements.point.borderWidth); } }); }; },{}],17:[function(require,module,exports){ "use strict"; module.exports = function(Chart) { var helpers = Chart.helpers; Chart.defaults.doughnut = { animation: { //Boolean - Whether we animate the rotation of the Doughnut animateRotate: true, //Boolean - Whether we animate scaling the Doughnut from the centre animateScale: false }, aspectRatio: 1, hover: { mode: 'single' }, legendCallback: function(chart) { var text = []; text.push('<ul class="' + chart.id + '-legend">'); if (chart.data.datasets.length) { for (var i = 0; i < chart.data.datasets[0].data.length; ++i) { text.push('<li><span style="background-color:' + chart.data.datasets[0].backgroundColor[i] + '"></span>'); if (chart.data.labels[i]) { text.push(chart.data.labels[i]); } text.push('</li>'); } } text.push('</ul>'); return text.join(""); }, legend: { labels: { generateLabels: function(chart) { var data = chart.data; if (data.labels.length && data.datasets.length) { return data.labels.map(function(label, i) { var meta = chart.getDatasetMeta(0); var ds = data.datasets[0]; var arc = meta.data[i]; var fill = arc.custom && arc.custom.backgroundColor ? arc.custom.backgroundColor : helpers.getValueAtIndexOrDefault(ds.backgroundColor, i, this.chart.options.elements.arc.backgroundColor); var stroke = arc.custom && arc.custom.borderColor ? arc.custom.borderColor : helpers.getValueAtIndexOrDefault(ds.borderColor, i, this.chart.options.elements.arc.borderColor); var bw = arc.custom && arc.custom.borderWidth ? arc.custom.borderWidth : helpers.getValueAtIndexOrDefault(ds.borderWidth, i, this.chart.options.elements.arc.borderWidth); return { text: label, fillStyle: fill, strokeStyle: stroke, lineWidth: bw, hidden: isNaN(ds.data[i]) || meta.data[i].hidden, // Extra data used for toggling the correct item index: i }; }, this); } else { return []; } } }, onClick: function(e, legendItem) { var index = legendItem.index; var chart = this.chart; var i, ilen, meta; for (i = 0, ilen = (chart.data.datasets || []).length; i < ilen; ++i) { meta = chart.getDatasetMeta(i); meta.data[index].hidden = !meta.data[index].hidden; } chart.update(); } }, //The percentage of the chart that we cut out of the middle. cutoutPercentage: 50, //The rotation of the chart, where the first data arc begins. rotation: Math.PI * -0.5, //The total circumference of the chart. circumference: Math.PI * 2.0, // Need to override these to give a nice default tooltips: { callbacks: { title: function() { return ''; }, label: function(tooltipItem, data) { return data.labels[tooltipItem.index] + ': ' + data.datasets[tooltipItem.datasetIndex].data[tooltipItem.index]; } } } }; Chart.defaults.pie = helpers.clone(Chart.defaults.doughnut); helpers.extend(Chart.defaults.pie, { cutoutPercentage: 0 }); Chart.controllers.doughnut = Chart.controllers.pie = Chart.DatasetController.extend({ linkScales: function() { // no scales for doughnut }, addElements: function() { var meta = this.getMeta(); helpers.each(this.getDataset().data, function(value, index) { meta.data[index] = meta.data[index] || new Chart.elements.Arc({ _chart: this.chart.chart, _datasetIndex: this.index, _index: index }); }, this); }, addElementAndReset: function(index, colorForNewElement) { var arc = new Chart.elements.Arc({ _chart: this.chart.chart, _datasetIndex: this.index, _index: index }); if (colorForNewElement && helpers.isArray(this.getDataset().backgroundColor)) { this.getDataset().backgroundColor.splice(index, 0, colorForNewElement); } // Add to the points array and reset it this.getMeta().data.splice(index, 0, arc); this.updateElement(arc, index, true); }, // Get index of the dataset in relation to the visible datasets. This allows determining the inner and outer radius correctly getRingIndex: function getRingIndex(datasetIndex) { var ringIndex = 0; for (var j = 0; j < datasetIndex; ++j) { if (this.chart.isDatasetVisible(j)) { ++ringIndex; } } return ringIndex; }, update: function update(reset) { var availableWidth = this.chart.chartArea.right - this.chart.chartArea.left - this.chart.options.elements.arc.borderWidth; var availableHeight = this.chart.chartArea.bottom - this.chart.chartArea.top - this.chart.options.elements.arc.borderWidth; var minSize = Math.min(availableWidth, availableHeight); var offset = {x: 0, y: 0}; // If the chart's circumference isn't a full circle, calculate minSize as a ratio of the width/height of the arc if (this.chart.options.circumference < Math.PI * 2.0) { var startAngle = this.chart.options.rotation % (Math.PI * 2.0); startAngle += Math.PI * 2.0 * (startAngle >= Math.PI ? -1 : startAngle < -Math.PI ? 1 : 0); var endAngle = startAngle + this.chart.options.circumference; var start = {x: Math.cos(startAngle), y: Math.sin(startAngle)}; var end = {x: Math.cos(endAngle), y: Math.sin(endAngle)}; var contains0 = (startAngle <= 0 && 0 <= endAngle) || (startAngle <= Math.PI * 2.0 && Math.PI * 2.0 <= endAngle); var contains90 = (startAngle <= Math.PI * 0.5 && Math.PI * 0.5 <= endAngle) || (startAngle <= Math.PI * 2.5 && Math.PI * 2.5 <= endAngle); var contains180 = (startAngle <= -Math.PI && -Math.PI <= endAngle) || (startAngle <= Math.PI && Math.PI <= endAngle); var contains270 = (startAngle <= -Math.PI * 0.5 && -Math.PI * 0.5 <= endAngle) || (startAngle <= Math.PI * 1.5 && Math.PI * 1.5 <= endAngle); var cutout = this.chart.options.cutoutPercentage / 100.0; var min = {x: contains180 ? -1 : Math.min(start.x * (start.x < 0 ? 1 : cutout), end.x * (end.x < 0 ? 1 : cutout)), y: contains270 ? -1 : Math.min(start.y * (start.y < 0 ? 1 : cutout), end.y * (end.y < 0 ? 1 : cutout))}; var max = {x: contains0 ? 1 : Math.max(start.x * (start.x > 0 ? 1 : cutout), end.x * (end.x > 0 ? 1 : cutout)), y: contains90 ? 1 : Math.max(start.y * (start.y > 0 ? 1 : cutout), end.y * (end.y > 0 ? 1 : cutout))}; var size = {width: (max.x - min.x) * 0.5, height: (max.y - min.y) * 0.5}; minSize = Math.min(availableWidth / size.width, availableHeight / size.height); offset = {x: (max.x + min.x) * -0.5, y: (max.y + min.y) * -0.5}; } this.chart.outerRadius = Math.max(minSize / 2, 0); this.chart.innerRadius = Math.max(this.chart.options.cutoutPercentage ? (this.chart.outerRadius / 100) * (this.chart.options.cutoutPercentage) : 1, 0); this.chart.radiusLength = (this.chart.outerRadius - this.chart.innerRadius) / this.chart.getVisibleDatasetCount(); this.chart.offsetX = offset.x * this.chart.outerRadius; this.chart.offsetY = offset.y * this.chart.outerRadius; this.getMeta().total = this.calculateTotal(); this.outerRadius = this.chart.outerRadius - (this.chart.radiusLength * this.getRingIndex(this.index)); this.innerRadius = this.outerRadius - this.chart.radiusLength; helpers.each(this.getMeta().data, function(arc, index) { this.updateElement(arc, index, reset); }, this); }, updateElement: function(arc, index, reset) { var centerX = (this.chart.chartArea.left + this.chart.chartArea.right) / 2; var centerY = (this.chart.chartArea.top + this.chart.chartArea.bottom) / 2; var startAngle = this.chart.options.rotation; // non reset case handled later var endAngle = this.chart.options.rotation; // non reset case handled later var circumference = reset && this.chart.options.animation.animateRotate ? 0 : arc.hidden? 0 : this.calculateCircumference(this.getDataset().data[index]) * (this.chart.options.circumference / (2.0 * Math.PI)); var innerRadius = reset && this.chart.options.animation.animateScale ? 0 : this.innerRadius; var outerRadius = reset && this.chart.options.animation.animateScale ? 0 : this.outerRadius; helpers.extend(arc, { // Utility _chart: this.chart.chart, _datasetIndex: this.index, _index: index, // Desired view properties _model: { x: centerX + this.chart.offsetX, y: centerY + this.chart.offsetY, startAngle: startAngle, endAngle: endAngle, circumference: circumference, outerRadius: outerRadius, innerRadius: innerRadius, backgroundColor: arc.custom && arc.custom.backgroundColor ? arc.custom.backgroundColor : helpers.getValueAtIndexOrDefault(this.getDataset().backgroundColor, index, this.chart.options.elements.arc.backgroundColor), hoverBackgroundColor: arc.custom && arc.custom.hoverBackgroundColor ? arc.custom.hoverBackgroundColor : helpers.getValueAtIndexOrDefault(this.getDataset().hoverBackgroundColor, index, this.chart.options.elements.arc.hoverBackgroundColor), borderWidth: arc.custom && arc.custom.borderWidth ? arc.custom.borderWidth : helpers.getValueAtIndexOrDefault(this.getDataset().borderWidth, index, this.chart.options.elements.arc.borderWidth), borderColor: arc.custom && arc.custom.borderColor ? arc.custom.borderColor : helpers.getValueAtIndexOrDefault(this.getDataset().borderColor, index, this.chart.options.elements.arc.borderColor), label: helpers.getValueAtIndexOrDefault(this.getDataset().label, index, this.chart.data.labels[index]) } }); // Set correct angles if not resetting if (!reset || !this.chart.options.animation.animateRotate) { if (index === 0) { arc._model.startAngle = this.chart.options.rotation; } else { arc._model.startAngle = this.getMeta().data[index - 1]._model.endAngle; } arc._model.endAngle = arc._model.startAngle + arc._model.circumference; } arc.pivot(); }, draw: function(ease) { var easingDecimal = ease || 1; helpers.each(this.getMeta().data, function(arc, index) { arc.transition(easingDecimal).draw(); }); }, setHoverStyle: function(arc) { var dataset = this.chart.data.datasets[arc._datasetIndex]; var index = arc._index; arc._model.backgroundColor = arc.custom && arc.custom.hoverBackgroundColor ? arc.custom.hoverBackgroundColor : helpers.getValueAtIndexOrDefault(dataset.hoverBackgroundColor, index, helpers.color(arc._model.backgroundColor).saturate(0.5).darken(0.1).rgbString()); arc._model.borderColor = arc.custom && arc.custom.hoverBorderColor ? arc.custom.hoverBorderColor : helpers.getValueAtIndexOrDefault(dataset.hoverBorderColor, index, helpers.color(arc._model.borderColor).saturate(0.5).darken(0.1).rgbString()); arc._model.borderWidth = arc.custom && arc.custom.hoverBorderWidth ? arc.custom.hoverBorderWidth : helpers.getValueAtIndexOrDefault(dataset.hoverBorderWidth, index, arc._model.borderWidth); }, removeHoverStyle: function(arc) { var dataset = this.chart.data.datasets[arc._datasetIndex]; var index = arc._index; arc._model.backgroundColor = arc.custom && arc.custom.backgroundColor ? arc.custom.backgroundColor : helpers.getValueAtIndexOrDefault(this.getDataset().backgroundColor, index, this.chart.options.elements.arc.backgroundColor); arc._model.borderColor = arc.custom && arc.custom.borderColor ? arc.custom.borderColor : helpers.getValueAtIndexOrDefault(this.getDataset().borderColor, index, this.chart.options.elements.arc.borderColor); arc._model.borderWidth = arc.custom && arc.custom.borderWidth ? arc.custom.borderWidth : helpers.getValueAtIndexOrDefault(this.getDataset().borderWidth, index, this.chart.options.elements.arc.borderWidth); }, calculateTotal: function() { var dataset = this.getDataset(); var meta = this.getMeta(); var total = 0; var value; helpers.each(meta.data, function(element, index) { value = dataset.data[index]; if (!isNaN(value) && !element.hidden) { total += Math.abs(value); } }); return total; }, calculateCircumference: function(value) { var total = this.getMeta().total; if (total > 0 && !isNaN(value)) { return (Math.PI * 2.0) * (value / total); } else { return 0; } } }); }; },{}],18:[function(require,module,exports){ "use strict"; module.exports = function(Chart) { var helpers = Chart.helpers; Chart.defaults.line = { showLines: true, hover: { mode: "label" }, scales: { xAxes: [{ type: "category", id: 'x-axis-0' }], yAxes: [{ type: "linear", id: 'y-axis-0' }] } }; Chart.controllers.line = Chart.DatasetController.extend({ addElements: function() { var meta = this.getMeta(); meta.dataset = meta.dataset || new Chart.elements.Line({ _chart: this.chart.chart, _datasetIndex: this.index, _points: meta.data }); helpers.each(this.getDataset().data, function(value, index) { meta.data[index] = meta.data[index] || new Chart.elements.Point({ _chart: this.chart.chart, _datasetIndex: this.index, _index: index }); }, this); }, addElementAndReset: function(index) { var point = new Chart.elements.Point({ _chart: this.chart.chart, _datasetIndex: this.index, _index: index }); // Add to the points array and reset it this.getMeta().data.splice(index, 0, point); this.updateElement(point, index, true); // Make sure bezier control points are updated if (this.chart.options.showLines && this.chart.options.elements.line.tension !== 0) this.updateBezierControlPoints(); }, update: function update(reset) { var meta = this.getMeta(); var line = meta.dataset; var points = meta.data; var yScale = this.getScaleForId(meta.yAxisID); var xScale = this.getScaleForId(meta.xAxisID); var scaleBase; if (yScale.min < 0 && yScale.max < 0) { scaleBase = yScale.getPixelForValue(yScale.max); } else if (yScale.min > 0 && yScale.max > 0) { scaleBase = yScale.getPixelForValue(yScale.min); } else { scaleBase = yScale.getPixelForValue(0); } // Update Line if (this.chart.options.showLines) { // Utility line._scale = yScale; line._datasetIndex = this.index; // Data line._children = points; // Model // Compatibility: If the properties are defined with only the old name, use those values if ((this.getDataset().tension !== undefined) && (this.getDataset().lineTension === undefined)) { this.getDataset().lineTension = this.getDataset().tension; } line._model = { // Appearance tension: line.custom && line.custom.tension ? line.custom.tension : helpers.getValueOrDefault(this.getDataset().lineTension, this.chart.options.elements.line.tension), backgroundColor: line.custom && line.custom.backgroundColor ? line.custom.backgroundColor : (this.getDataset().backgroundColor || this.chart.options.elements.line.backgroundColor), borderWidth: line.custom && line.custom.borderWidth ? line.custom.borderWidth : (this.getDataset().borderWidth || this.chart.options.elements.line.borderWidth), borderColor: line.custom && line.custom.borderColor ? line.custom.borderColor : (this.getDataset().borderColor || this.chart.options.elements.line.borderColor), borderCapStyle: line.custom && line.custom.borderCapStyle ? line.custom.borderCapStyle : (this.getDataset().borderCapStyle || this.chart.options.elements.line.borderCapStyle), borderDash: line.custom && line.custom.borderDash ? line.custom.borderDash : (this.getDataset().borderDash || this.chart.options.elements.line.borderDash), borderDashOffset: line.custom && line.custom.borderDashOffset ? line.custom.borderDashOffset : (this.getDataset().borderDashOffset || this.chart.options.elements.line.borderDashOffset), borderJoinStyle: line.custom && line.custom.borderJoinStyle ? line.custom.borderJoinStyle : (this.getDataset().borderJoinStyle || this.chart.options.elements.line.borderJoinStyle), fill: line.custom && line.custom.fill ? line.custom.fill : (this.getDataset().fill !== undefined ? this.getDataset().fill : this.chart.options.elements.line.fill), // Scale scaleTop: yScale.top, scaleBottom: yScale.bottom, scaleZero: scaleBase }; line.pivot(); } // Update Points helpers.each(points, function(point, index) { this.updateElement(point, index, reset); }, this); if (this.chart.options.showLines && this.chart.options.elements.line.tension !== 0) this.updateBezierControlPoints(); }, getPointBackgroundColor: function(point, index) { var backgroundColor = this.chart.options.elements.point.backgroundColor; var dataset = this.getDataset(); if (point.custom && point.custom.backgroundColor) { backgroundColor = point.custom.backgroundColor; } else if (dataset.pointBackgroundColor) { backgroundColor = helpers.getValueAtIndexOrDefault(dataset.pointBackgroundColor, index, backgroundColor); } else if (dataset.backgroundColor) { backgroundColor = dataset.backgroundColor; } return backgroundColor; }, getPointBorderColor: function(point, index) { var borderColor = this.chart.options.elements.point.borderColor; var dataset = this.getDataset(); if (point.custom && point.custom.borderColor) { borderColor = point.custom.borderColor; } else if (dataset.pointBorderColor) { borderColor = helpers.getValueAtIndexOrDefault(this.getDataset().pointBorderColor, index, borderColor); } else if (dataset.borderColor) { borderColor = dataset.borderColor; } return borderColor; }, getPointBorderWidth: function(point, index) { var borderWidth = this.chart.options.elements.point.borderWidth; var dataset = this.getDataset(); if (point.custom && point.custom.borderWidth !== undefined) { borderWidth = point.custom.borderWidth; } else if (dataset.pointBorderWidth !== undefined) { borderWidth = helpers.getValueAtIndexOrDefault(dataset.pointBorderWidth, index, borderWidth); } else if (dataset.borderWidth !== undefined) { borderWidth = dataset.borderWidth; } return borderWidth; }, updateElement: function(point, index, reset) { var meta = this.getMeta(); var yScale = this.getScaleForId(meta.yAxisID); var xScale = this.getScaleForId(meta.xAxisID); var scaleBase; if (yScale.min < 0 && yScale.max < 0) { scaleBase = yScale.getPixelForValue(yScale.max); } else if (yScale.min > 0 && yScale.max > 0) { scaleBase = yScale.getPixelForValue(yScale.min); } else { scaleBase = yScale.getPixelForValue(0); } // Utility point._chart = this.chart.chart; point._xScale = xScale; point._yScale = yScale; point._datasetIndex = this.index; point._index = index; // Desired view properties // Compatibility: If the properties are defined with only the old name, use those values if ((this.getDataset().radius !== undefined) && (this.getDataset().pointRadius === undefined)) { this.getDataset().pointRadius = this.getDataset().radius; } if ((this.getDataset().hitRadius !== undefined) && (this.getDataset().pointHitRadius === undefined)) { this.getDataset().pointHitRadius = this.getDataset().hitRadius; } point._model = { x: xScale.getPixelForValue(this.getDataset().data[index], index, this.index, this.chart.isCombo), y: reset ? scaleBase : this.calculatePointY(this.getDataset().data[index], index, this.index, this.chart.isCombo), // Appearance radius: point.custom && point.custom.radius ? point.custom.radius : helpers.getValueAtIndexOrDefault(this.getDataset().pointRadius, index, this.chart.options.elements.point.radius), pointStyle: point.custom && point.custom.pointStyle ? point.custom.pointStyle : helpers.getValueAtIndexOrDefault(this.getDataset().pointStyle, index, this.chart.options.elements.point.pointStyle), backgroundColor: this.getPointBackgroundColor(point, index), borderColor: this.getPointBorderColor(point, index), borderWidth: this.getPointBorderWidth(point, index), tension: meta.dataset._model ? meta.dataset._model.tension : 0, // Tooltip hitRadius: point.custom && point.custom.hitRadius ? point.custom.hitRadius : helpers.getValueAtIndexOrDefault(this.getDataset().pointHitRadius, index, this.chart.options.elements.point.hitRadius) }; point._model.skip = point.custom && point.custom.skip ? point.custom.skip : (isNaN(point._model.x) || isNaN(point._model.y)); }, calculatePointY: function(value, index, datasetIndex, isCombo) { var meta = this.getMeta(); var xScale = this.getScaleForId(meta.xAxisID); var yScale = this.getScaleForId(meta.yAxisID); if (yScale.options.stacked) { var sumPos = 0, sumNeg = 0; for (var i = 0; i < datasetIndex; i++) { var ds = this.chart.data.datasets[i]; var dsMeta = this.chart.getDatasetMeta(i); if (dsMeta.type === 'line' && this.chart.isDatasetVisible(i)) { if (ds.data[index] < 0) { sumNeg += ds.data[index] || 0; } else { sumPos += ds.data[index] || 0; } } } if (value < 0) { return yScale.getPixelForValue(sumNeg + value); } else { return yScale.getPixelForValue(sumPos + value); } } return yScale.getPixelForValue(value); }, updateBezierControlPoints: function() { // Update bezier control points var meta = this.getMeta(); helpers.each(meta.data, function(point, index) { var controlPoints = helpers.splineCurve( helpers.previousItem(meta.data, index)._model, point._model, helpers.nextItem(meta.data, index)._model, meta.dataset._model.tension ); // Prevent the bezier going outside of the bounds of the graph point._model.controlPointPreviousX = Math.max(Math.min(controlPoints.previous.x, this.chart.chartArea.right), this.chart.chartArea.left); point._model.controlPointPreviousY = Math.max(Math.min(controlPoints.previous.y, this.chart.chartArea.bottom), this.chart.chartArea.top); point._model.controlPointNextX = Math.max(Math.min(controlPoints.next.x, this.chart.chartArea.right), this.chart.chartArea.left); point._model.controlPointNextY = Math.max(Math.min(controlPoints.next.y, this.chart.chartArea.bottom), this.chart.chartArea.top); // Now pivot the point for animation point.pivot(); }, this); }, draw: function(ease) { var meta = this.getMeta(); var easingDecimal = ease || 1; // Transition Point Locations helpers.each(meta.data, function(point) { point.transition(easingDecimal); }); // Transition and Draw the line if (this.chart.options.showLines) meta.dataset.transition(easingDecimal).draw(); // Draw the points helpers.each(meta.data, function(point) { point.draw(); }); }, setHoverStyle: function(point) { // Point var dataset = this.chart.data.datasets[point._datasetIndex]; var index = point._index; point._model.radius = point.custom && point.custom.hoverRadius ? point.custom.hoverRadius : helpers.getValueAtIndexOrDefault(dataset.pointHoverRadius, index, this.chart.options.elements.point.hoverRadius); point._model.backgroundColor = point.custom && point.custom.hoverBackgroundColor ? point.custom.hoverBackgroundColor : helpers.getValueAtIndexOrDefault(dataset.pointHoverBackgroundColor, index, helpers.color(point._model.backgroundColor).saturate(0.5).darken(0.1).rgbString()); point._model.borderColor = point.custom && point.custom.hoverBorderColor ? point.custom.hoverBorderColor : helpers.getValueAtIndexOrDefault(dataset.pointHoverBorderColor, index, helpers.color(point._model.borderColor).saturate(0.5).darken(0.1).rgbString()); point._model.borderWidth = point.custom && point.custom.hoverBorderWidth ? point.custom.hoverBorderWidth : helpers.getValueAtIndexOrDefault(dataset.pointHoverBorderWidth, index, point._model.borderWidth); }, removeHoverStyle: function(point) { var dataset = this.chart.data.datasets[point._datasetIndex]; var index = point._index; // Compatibility: If the properties are defined with only the old name, use those values if ((this.getDataset().radius !== undefined) && (this.getDataset().pointRadius === undefined)) { this.getDataset().pointRadius = this.getDataset().radius; } point._model.radius = point.custom && point.custom.radius ? point.custom.radius : helpers.getValueAtIndexOrDefault(this.getDataset().pointRadius, index, this.chart.options.elements.point.radius); point._model.backgroundColor = this.getPointBackgroundColor(point, index); point._model.borderColor = this.getPointBorderColor(point, index); point._model.borderWidth = this.getPointBorderWidth(point, index); } }); }; },{}],19:[function(require,module,exports){ "use strict"; module.exports = function(Chart) { var helpers = Chart.helpers; Chart.defaults.polarArea = { scale: { type: "radialLinear", lineArc: true // so that lines are circular }, //Boolean - Whether to animate the rotation of the chart animation: { animateRotate: true, animateScale: true }, aspectRatio: 1, legendCallback: function(chart) { var text = []; text.push('<ul class="' + chart.id + '-legend">'); if (chart.data.datasets.length) { for (var i = 0; i < chart.data.datasets[0].data.length; ++i) { text.push('<li><span style="background-color:' + chart.data.datasets[0].backgroundColor[i] + '">'); if (chart.data.labels[i]) { text.push(chart.data.labels[i]); } text.push('</span></li>'); } } text.push('</ul>'); return text.join(""); }, legend: { labels: { generateLabels: function(chart) { var data = chart.data; if (data.labels.length && data.datasets.length) { return data.labels.map(function(label, i) { var meta = chart.getDatasetMeta(0); var ds = data.datasets[0]; var arc = meta.data[i]; var fill = arc.custom && arc.custom.backgroundColor ? arc.custom.backgroundColor : helpers.getValueAtIndexOrDefault(ds.backgroundColor, i, this.chart.options.elements.arc.backgroundColor); var stroke = arc.custom && arc.custom.borderColor ? arc.custom.borderColor : helpers.getValueAtIndexOrDefault(ds.borderColor, i, this.chart.options.elements.arc.borderColor); var bw = arc.custom && arc.custom.borderWidth ? arc.custom.borderWidth : helpers.getValueAtIndexOrDefault(ds.borderWidth, i, this.chart.options.elements.arc.borderWidth); return { text: label, fillStyle: fill, strokeStyle: stroke, lineWidth: bw, hidden: isNaN(ds.data[i]) || meta.data[i].hidden, // Extra data used for toggling the correct item index: i }; }, this); } else { return []; } } }, onClick: function(e, legendItem) { var index = legendItem.index; var chart = this.chart; var i, ilen, meta; for (i = 0, ilen = (chart.data.datasets || []).length; i < ilen; ++i) { meta = chart.getDatasetMeta(i); meta.data[index].hidden = !meta.data[index].hidden; } chart.update(); } }, // Need to override these to give a nice default tooltips: { callbacks: { title: function() { return ''; }, label: function(tooltipItem, data) { return data.labels[tooltipItem.index] + ': ' + tooltipItem.yLabel; } } } }; Chart.controllers.polarArea = Chart.DatasetController.extend({ linkScales: function() { // no scales for doughnut }, addElements: function() { var meta = this.getMeta(); helpers.each(this.getDataset().data, function(value, index) { meta.data[index] = meta.data[index] || new Chart.elements.Arc({ _chart: this.chart.chart, _datasetIndex: this.index, _index: index }); }, this); }, addElementAndReset: function(index) { var arc = new Chart.elements.Arc({ _chart: this.chart.chart, _datasetIndex: this.index, _index: index }); // Add to the points array and reset it this.getMeta().data.splice(index, 0, arc); this.updateElement(arc, index, true); }, update: function update(reset) { var meta = this.getMeta(); var minSize = Math.min(this.chart.chartArea.right - this.chart.chartArea.left, this.chart.chartArea.bottom - this.chart.chartArea.top); this.chart.outerRadius = Math.max((minSize - this.chart.options.elements.arc.borderWidth / 2) / 2, 0); this.chart.innerRadius = Math.max(this.chart.options.cutoutPercentage ? (this.chart.outerRadius / 100) * (this.chart.options.cutoutPercentage) : 1, 0); this.chart.radiusLength = (this.chart.outerRadius - this.chart.innerRadius) / this.chart.getVisibleDatasetCount(); this.outerRadius = this.chart.outerRadius - (this.chart.radiusLength * this.index); this.innerRadius = this.outerRadius - this.chart.radiusLength; meta.count = this.countVisibleElements(); helpers.each(meta.data, function(arc, index) { this.updateElement(arc, index, reset); }, this); }, updateElement: function(arc, index, reset) { var circumference = this.calculateCircumference(this.getDataset().data[index]); var centerX = (this.chart.chartArea.left + this.chart.chartArea.right) / 2; var centerY = (this.chart.chartArea.top + this.chart.chartArea.bottom) / 2; // If there is NaN data before us, we need to calculate the starting angle correctly. // We could be way more efficient here, but its unlikely that the polar area chart will have a lot of data var visibleCount = 0; var meta = this.getMeta(); for (var i = 0; i < index; ++i) { if (!isNaN(this.getDataset().data[i]) && !meta.data[i].hidden) { ++visibleCount; } } var distance = arc.hidden? 0 : this.chart.scale.getDistanceFromCenterForValue(this.getDataset().data[index]); var startAngle = (-0.5 * Math.PI) + (circumference * visibleCount); var endAngle = startAngle + (arc.hidden? 0 : circumference); var resetModel = { x: centerX, y: centerY, innerRadius: 0, outerRadius: this.chart.options.animation.animateScale ? 0 : this.chart.scale.getDistanceFromCenterForValue(this.getDataset().data[index]), startAngle: this.chart.options.animation.animateRotate ? Math.PI * -0.5 : startAngle, endAngle: this.chart.options.animation.animateRotate ? Math.PI * -0.5 : endAngle, backgroundColor: arc.custom && arc.custom.backgroundColor ? arc.custom.backgroundColor : helpers.getValueAtIndexOrDefault(this.getDataset().backgroundColor, index, this.chart.options.elements.arc.backgroundColor), borderWidth: arc.custom && arc.custom.borderWidth ? arc.custom.borderWidth : helpers.getValueAtIndexOrDefault(this.getDataset().borderWidth, index, this.chart.options.elements.arc.borderWidth), borderColor: arc.custom && arc.custom.borderColor ? arc.custom.borderColor : helpers.getValueAtIndexOrDefault(this.getDataset().borderColor, index, this.chart.options.elements.arc.borderColor), label: helpers.getValueAtIndexOrDefault(this.chart.data.labels, index, this.chart.data.labels[index]) }; helpers.extend(arc, { // Utility _chart: this.chart.chart, _datasetIndex: this.index, _index: index, _scale: this.chart.scale, // Desired view properties _model: reset ? resetModel : { x: centerX, y: centerY, innerRadius: 0, outerRadius: distance, startAngle: startAngle, endAngle: endAngle, backgroundColor: arc.custom && arc.custom.backgroundColor ? arc.custom.backgroundColor : helpers.getValueAtIndexOrDefault(this.getDataset().backgroundColor, index, this.chart.options.elements.arc.backgroundColor), borderWidth: arc.custom && arc.custom.borderWidth ? arc.custom.borderWidth : helpers.getValueAtIndexOrDefault(this.getDataset().borderWidth, index, this.chart.options.elements.arc.borderWidth), borderColor: arc.custom && arc.custom.borderColor ? arc.custom.borderColor : helpers.getValueAtIndexOrDefault(this.getDataset().borderColor, index, this.chart.options.elements.arc.borderColor), label: helpers.getValueAtIndexOrDefault(this.chart.data.labels, index, this.chart.data.labels[index]) } }); arc.pivot(); }, draw: function(ease) { var easingDecimal = ease || 1; helpers.each(this.getMeta().data, function(arc, index) { arc.transition(easingDecimal).draw(); }); }, setHoverStyle: function(arc) { var dataset = this.chart.data.datasets[arc._datasetIndex]; var index = arc._index; arc._model.backgroundColor = arc.custom && arc.custom.hoverBackgroundColor ? arc.custom.hoverBackgroundColor : helpers.getValueAtIndexOrDefault(dataset.hoverBackgroundColor, index, helpers.color(arc._model.backgroundColor).saturate(0.5).darken(0.1).rgbString()); arc._model.borderColor = arc.custom && arc.custom.hoverBorderColor ? arc.custom.hoverBorderColor : helpers.getValueAtIndexOrDefault(dataset.hoverBorderColor, index, helpers.color(arc._model.borderColor).saturate(0.5).darken(0.1).rgbString()); arc._model.borderWidth = arc.custom && arc.custom.hoverBorderWidth ? arc.custom.hoverBorderWidth : helpers.getValueAtIndexOrDefault(dataset.hoverBorderWidth, index, arc._model.borderWidth); }, removeHoverStyle: function(arc) { var dataset = this.chart.data.datasets[arc._datasetIndex]; var index = arc._index; arc._model.backgroundColor = arc.custom && arc.custom.backgroundColor ? arc.custom.backgroundColor : helpers.getValueAtIndexOrDefault(this.getDataset().backgroundColor, index, this.chart.options.elements.arc.backgroundColor); arc._model.borderColor = arc.custom && arc.custom.borderColor ? arc.custom.borderColor : helpers.getValueAtIndexOrDefault(this.getDataset().borderColor, index, this.chart.options.elements.arc.borderColor); arc._model.borderWidth = arc.custom && arc.custom.borderWidth ? arc.custom.borderWidth : helpers.getValueAtIndexOrDefault(this.getDataset().borderWidth, index, this.chart.options.elements.arc.borderWidth); }, countVisibleElements: function() { var dataset = this.getDataset(); var meta = this.getMeta(); var count = 0; helpers.each(meta.data, function(element, index) { if (!isNaN(dataset.data[index]) && !element.hidden) { count++; } }); return count; }, calculateCircumference: function(value) { var count = this.getMeta().count; if (count > 0 && !isNaN(value)) { return (2 * Math.PI) / count; } else { return 0; } } }); }; },{}],20:[function(require,module,exports){ "use strict"; module.exports = function(Chart) { var helpers = Chart.helpers; Chart.defaults.radar = { scale: { type: "radialLinear" }, elements: { line: { tension: 0 // no bezier in radar } } }; Chart.controllers.radar = Chart.DatasetController.extend({ linkScales: function() { // No need. Single scale only }, addElements: function() { var meta = this.getMeta(); meta.dataset = meta.dataset || new Chart.elements.Line({ _chart: this.chart.chart, _datasetIndex: this.index, _points: meta.data, _loop: true }); helpers.each(this.getDataset().data, function(value, index) { meta.data[index] = meta.data[index] || new Chart.elements.Point({ _chart: this.chart.chart, _datasetIndex: this.index, _index: index, _model: { x: 0, //xScale.getPixelForValue(null, index, true), y: 0 //this.chartArea.bottom, } }); }, this); }, addElementAndReset: function(index) { var point = new Chart.elements.Point({ _chart: this.chart.chart, _datasetIndex: this.index, _index: index }); // Add to the points array and reset it this.getMeta().data.splice(index, 0, point); this.updateElement(point, index, true); // Make sure bezier control points are updated this.updateBezierControlPoints(); }, update: function update(reset) { var meta = this.getMeta(); var line = meta.dataset; var points = meta.data; var scale = this.chart.scale; var scaleBase; if (scale.min < 0 && scale.max < 0) { scaleBase = scale.getPointPositionForValue(0, scale.max); } else if (scale.min > 0 && scale.max > 0) { scaleBase = scale.getPointPositionForValue(0, scale.min); } else { scaleBase = scale.getPointPositionForValue(0, 0); } // Compatibility: If the properties are defined with only the old name, use those values if ((this.getDataset().tension !== undefined) && (this.getDataset().lineTension === undefined)) { this.getDataset().lineTension = this.getDataset().tension; } helpers.extend(meta.dataset, { // Utility _datasetIndex: this.index, // Data _children: points, // Model _model: { // Appearance tension: line.custom && line.custom.tension ? line.custom.tension : helpers.getValueOrDefault(this.getDataset().lineTension, this.chart.options.elements.line.tension), backgroundColor: line.custom && line.custom.backgroundColor ? line.custom.backgroundColor : (this.getDataset().backgroundColor || this.chart.options.elements.line.backgroundColor), borderWidth: line.custom && line.custom.borderWidth ? line.custom.borderWidth : (this.getDataset().borderWidth || this.chart.options.elements.line.borderWidth), borderColor: line.custom && line.custom.borderColor ? line.custom.borderColor : (this.getDataset().borderColor || this.chart.options.elements.line.borderColor), fill: line.custom && line.custom.fill ? line.custom.fill : (this.getDataset().fill !== undefined ? this.getDataset().fill : this.chart.options.elements.line.fill), borderCapStyle: line.custom && line.custom.borderCapStyle ? line.custom.borderCapStyle : (this.getDataset().borderCapStyle || this.chart.options.elements.line.borderCapStyle), borderDash: line.custom && line.custom.borderDash ? line.custom.borderDash : (this.getDataset().borderDash || this.chart.options.elements.line.borderDash), borderDashOffset: line.custom && line.custom.borderDashOffset ? line.custom.borderDashOffset : (this.getDataset().borderDashOffset || this.chart.options.elements.line.borderDashOffset), borderJoinStyle: line.custom && line.custom.borderJoinStyle ? line.custom.borderJoinStyle : (this.getDataset().borderJoinStyle || this.chart.options.elements.line.borderJoinStyle), // Scale scaleTop: scale.top, scaleBottom: scale.bottom, scaleZero: scaleBase } }); meta.dataset.pivot(); // Update Points helpers.each(points, function(point, index) { this.updateElement(point, index, reset); }, this); // Update bezier control points this.updateBezierControlPoints(); }, updateElement: function(point, index, reset) { var pointPosition = this.chart.scale.getPointPositionForValue(index, this.getDataset().data[index]); helpers.extend(point, { // Utility _datasetIndex: this.index, _index: index, _scale: this.chart.scale, // Desired view properties _model: { x: reset ? this.chart.scale.xCenter : pointPosition.x, // value not used in dataset scale, but we want a consistent API between scales y: reset ? this.chart.scale.yCenter : pointPosition.y, // Appearance tension: point.custom && point.custom.tension ? point.custom.tension : helpers.getValueOrDefault(this.getDataset().tension, this.chart.options.elements.line.tension), radius: point.custom && point.custom.radius ? point.custom.radius : helpers.getValueAtIndexOrDefault(this.getDataset().pointRadius, index, this.chart.options.elements.point.radius), backgroundColor: point.custom && point.custom.backgroundColor ? point.custom.backgroundColor : helpers.getValueAtIndexOrDefault(this.getDataset().pointBackgroundColor, index, this.chart.options.elements.point.backgroundColor), borderColor: point.custom && point.custom.borderColor ? point.custom.borderColor : helpers.getValueAtIndexOrDefault(this.getDataset().pointBorderColor, index, this.chart.options.elements.point.borderColor), borderWidth: point.custom && point.custom.borderWidth ? point.custom.borderWidth : helpers.getValueAtIndexOrDefault(this.getDataset().pointBorderWidth, index, this.chart.options.elements.point.borderWidth), pointStyle: point.custom && point.custom.pointStyle ? point.custom.pointStyle : helpers.getValueAtIndexOrDefault(this.getDataset().pointStyle, index, this.chart.options.elements.point.pointStyle), // Tooltip hitRadius: point.custom && point.custom.hitRadius ? point.custom.hitRadius : helpers.getValueAtIndexOrDefault(this.getDataset().hitRadius, index, this.chart.options.elements.point.hitRadius) } }); point._model.skip = point.custom && point.custom.skip ? point.custom.skip : (isNaN(point._model.x) || isNaN(point._model.y)); }, updateBezierControlPoints: function() { var meta = this.getMeta(); helpers.each(meta.data, function(point, index) { var controlPoints = helpers.splineCurve( helpers.previousItem(meta.data, index, true)._model, point._model, helpers.nextItem(meta.data, index, true)._model, point._model.tension ); // Prevent the bezier going outside of the bounds of the graph point._model.controlPointPreviousX = Math.max(Math.min(controlPoints.previous.x, this.chart.chartArea.right), this.chart.chartArea.left); point._model.controlPointPreviousY = Math.max(Math.min(controlPoints.previous.y, this.chart.chartArea.bottom), this.chart.chartArea.top); point._model.controlPointNextX = Math.max(Math.min(controlPoints.next.x, this.chart.chartArea.right), this.chart.chartArea.left); point._model.controlPointNextY = Math.max(Math.min(controlPoints.next.y, this.chart.chartArea.bottom), this.chart.chartArea.top); // Now pivot the point for animation point.pivot(); }, this); }, draw: function(ease) { var meta = this.getMeta(); var easingDecimal = ease || 1; // Transition Point Locations helpers.each(meta.data, function(point, index) { point.transition(easingDecimal); }); // Transition and Draw the line meta.dataset.transition(easingDecimal).draw(); // Draw the points helpers.each(meta.data, function(point) { point.draw(); }); }, setHoverStyle: function(point) { // Point var dataset = this.chart.data.datasets[point._datasetIndex]; var index = point._index; point._model.radius = point.custom && point.custom.hoverRadius ? point.custom.hoverRadius : helpers.getValueAtIndexOrDefault(dataset.pointHoverRadius, index, this.chart.options.elements.point.hoverRadius); point._model.backgroundColor = point.custom && point.custom.hoverBackgroundColor ? point.custom.hoverBackgroundColor : helpers.getValueAtIndexOrDefault(dataset.pointHoverBackgroundColor, index, helpers.color(point._model.backgroundColor).saturate(0.5).darken(0.1).rgbString()); point._model.borderColor = point.custom && point.custom.hoverBorderColor ? point.custom.hoverBorderColor : helpers.getValueAtIndexOrDefault(dataset.pointHoverBorderColor, index, helpers.color(point._model.borderColor).saturate(0.5).darken(0.1).rgbString()); point._model.borderWidth = point.custom && point.custom.hoverBorderWidth ? point.custom.hoverBorderWidth : helpers.getValueAtIndexOrDefault(dataset.pointHoverBorderWidth, index, point._model.borderWidth); }, removeHoverStyle: function(point) { var dataset = this.chart.data.datasets[point._datasetIndex]; var index = point._index; point._model.radius = point.custom && point.custom.radius ? point.custom.radius : helpers.getValueAtIndexOrDefault(this.getDataset().radius, index, this.chart.options.elements.point.radius); point._model.backgroundColor = point.custom && point.custom.backgroundColor ? point.custom.backgroundColor : helpers.getValueAtIndexOrDefault(this.getDataset().pointBackgroundColor, index, this.chart.options.elements.point.backgroundColor); point._model.borderColor = point.custom && point.custom.borderColor ? point.custom.borderColor : helpers.getValueAtIndexOrDefault(this.getDataset().pointBorderColor, index, this.chart.options.elements.point.borderColor); point._model.borderWidth = point.custom && point.custom.borderWidth ? point.custom.borderWidth : helpers.getValueAtIndexOrDefault(this.getDataset().pointBorderWidth, index, this.chart.options.elements.point.borderWidth); } }); }; },{}],21:[function(require,module,exports){ /*global window: false */ "use strict"; module.exports = function(Chart) { var helpers = Chart.helpers; Chart.defaults.global.animation = { duration: 1000, easing: "easeOutQuart", onProgress: helpers.noop, onComplete: helpers.noop }; Chart.Animation = Chart.Element.extend({ currentStep: null, // the current animation step numSteps: 60, // default number of steps easing: "", // the easing to use for this animation render: null, // render function used by the animation service onAnimationProgress: null, // user specified callback to fire on each step of the animation onAnimationComplete: null // user specified callback to fire when the animation finishes }); Chart.animationService = { frameDuration: 17, animations: [], dropFrames: 0, request: null, addAnimation: function(chartInstance, animationObject, duration, lazy) { if (!lazy) { chartInstance.animating = true; } for (var index = 0; index < this.animations.length; ++index) { if (this.animations[index].chartInstance === chartInstance) { // replacing an in progress animation this.animations[index].animationObject = animationObject; return; } } this.animations.push({ chartInstance: chartInstance, animationObject: animationObject }); // If there are no animations queued, manually kickstart a digest, for lack of a better word if (this.animations.length === 1) { this.requestAnimationFrame(); } }, // Cancel the animation for a given chart instance cancelAnimation: function(chartInstance) { var index = helpers.findIndex(this.animations, function(animationWrapper) { return animationWrapper.chartInstance === chartInstance; }); if (index !== -1) { this.animations.splice(index, 1); chartInstance.animating = false; } }, requestAnimationFrame: function() { var me = this; if (me.request === null) { // Skip animation frame requests until the active one is executed. // This can happen when processing mouse events, e.g. 'mousemove' // and 'mouseout' events will trigger multiple renders. me.request = helpers.requestAnimFrame.call(window, function() { me.request = null; me.startDigest(); }); } }, startDigest: function() { var startTime = Date.now(); var framesToDrop = 0; if (this.dropFrames > 1) { framesToDrop = Math.floor(this.dropFrames); this.dropFrames = this.dropFrames % 1; } var i = 0; while (i < this.animations.length) { if (this.animations[i].animationObject.currentStep === null) { this.animations[i].animationObject.currentStep = 0; } this.animations[i].animationObject.currentStep += 1 + framesToDrop; if (this.animations[i].animationObject.currentStep > this.animations[i].animationObject.numSteps) { this.animations[i].animationObject.currentStep = this.animations[i].animationObject.numSteps; } this.animations[i].animationObject.render(this.animations[i].chartInstance, this.animations[i].animationObject); if (this.animations[i].animationObject.onAnimationProgress && this.animations[i].animationObject.onAnimationProgress.call) { this.animations[i].animationObject.onAnimationProgress.call(this.animations[i].chartInstance, this.animations[i]); } if (this.animations[i].animationObject.currentStep === this.animations[i].animationObject.numSteps) { if (this.animations[i].animationObject.onAnimationComplete && this.animations[i].animationObject.onAnimationComplete.call) { this.animations[i].animationObject.onAnimationComplete.call(this.animations[i].chartInstance, this.animations[i]); } // executed the last frame. Remove the animation. this.animations[i].chartInstance.animating = false; this.animations.splice(i, 1); } else { ++i; } } var endTime = Date.now(); var dropFrames = (endTime - startTime) / this.frameDuration; this.dropFrames += dropFrames; // Do we have more stuff to animate? if (this.animations.length > 0) { this.requestAnimationFrame(); } } }; }; },{}],22:[function(require,module,exports){ "use strict"; module.exports = function(Chart) { var helpers = Chart.helpers; //Create a dictionary of chart types, to allow for extension of existing types Chart.types = {}; //Store a reference to each instance - allowing us to globally resize chart instances on window resize. //Destroy method on the chart will remove the instance of the chart from this reference. Chart.instances = {}; // Controllers available for dataset visualization eg. bar, line, slice, etc. Chart.controllers = {}; // The main controller of a chart Chart.Controller = function(instance) { this.chart = instance; this.config = instance.config; this.options = this.config.options = helpers.configMerge(Chart.defaults.global, Chart.defaults[this.config.type], this.config.options || {}); this.id = helpers.uid(); Object.defineProperty(this, 'data', { get: function() { return this.config.data; } }); //Add the chart instance to the global namespace Chart.instances[this.id] = this; if (this.options.responsive) { // Silent resize before chart draws this.resize(true); } this.initialize(); return this; }; helpers.extend(Chart.Controller.prototype, { initialize: function initialize() { // Before init plugin notification Chart.pluginService.notifyPlugins('beforeInit', [this]); this.bindEvents(); // Make sure controllers are built first so that each dataset is bound to an axis before the scales // are built this.ensureScalesHaveIDs(); this.buildOrUpdateControllers(); this.buildScales(); this.buildSurroundingItems(); this.updateLayout(); this.resetElements(); this.initToolTip(); this.update(); // After init plugin notification Chart.pluginService.notifyPlugins('afterInit', [this]); return this; }, clear: function clear() { helpers.clear(this.chart); return this; }, stop: function stop() { // Stops any current animation loop occuring Chart.animationService.cancelAnimation(this); return this; }, resize: function resize(silent) { var canvas = this.chart.canvas; var newWidth = helpers.getMaximumWidth(this.chart.canvas); var newHeight = (this.options.maintainAspectRatio && isNaN(this.chart.aspectRatio) === false && isFinite(this.chart.aspectRatio) && this.chart.aspectRatio !== 0) ? newWidth / this.chart.aspectRatio : helpers.getMaximumHeight(this.chart.canvas); var sizeChanged = this.chart.width !== newWidth || this.chart.height !== newHeight; if (!sizeChanged) return this; canvas.width = this.chart.width = newWidth; canvas.height = this.chart.height = newHeight; helpers.retinaScale(this.chart); if (!silent) { this.stop(); this.update(this.options.responsiveAnimationDuration); } return this; }, ensureScalesHaveIDs: function ensureScalesHaveIDs() { var defaultXAxisID = 'x-axis-'; var defaultYAxisID = 'y-axis-'; if (this.options.scales) { if (this.options.scales.xAxes && this.options.scales.xAxes.length) { helpers.each(this.options.scales.xAxes, function(xAxisOptions, index) { xAxisOptions.id = xAxisOptions.id || (defaultXAxisID + index); }); } if (this.options.scales.yAxes && this.options.scales.yAxes.length) { // Build the y axes helpers.each(this.options.scales.yAxes, function(yAxisOptions, index) { yAxisOptions.id = yAxisOptions.id || (defaultYAxisID + index); }); } } }, buildScales: function buildScales() { // Map of scale ID to scale object so we can lookup later this.scales = {}; // Build the x axes if (this.options.scales) { if (this.options.scales.xAxes && this.options.scales.xAxes.length) { helpers.each(this.options.scales.xAxes, function(xAxisOptions, index) { var xType = helpers.getValueOrDefault(xAxisOptions.type, 'category'); var ScaleClass = Chart.scaleService.getScaleConstructor(xType); if (ScaleClass) { var scale = new ScaleClass({ ctx: this.chart.ctx, options: xAxisOptions, chart: this, id: xAxisOptions.id }); this.scales[scale.id] = scale; } }, this); } if (this.options.scales.yAxes && this.options.scales.yAxes.length) { // Build the y axes helpers.each(this.options.scales.yAxes, function(yAxisOptions, index) { var yType = helpers.getValueOrDefault(yAxisOptions.type, 'linear'); var ScaleClass = Chart.scaleService.getScaleConstructor(yType); if (ScaleClass) { var scale = new ScaleClass({ ctx: this.chart.ctx, options: yAxisOptions, chart: this, id: yAxisOptions.id }); this.scales[scale.id] = scale; } }, this); } } if (this.options.scale) { // Build radial axes var ScaleClass = Chart.scaleService.getScaleConstructor(this.options.scale.type); if (ScaleClass) { var scale = new ScaleClass({ ctx: this.chart.ctx, options: this.options.scale, chart: this }); this.scale = scale; this.scales.radialScale = scale; } } Chart.scaleService.addScalesToLayout(this); }, buildSurroundingItems: function() { if (this.options.title) { this.titleBlock = new Chart.Title({ ctx: this.chart.ctx, options: this.options.title, chart: this }); Chart.layoutService.addBox(this, this.titleBlock); } if (this.options.legend) { this.legend = new Chart.Legend({ ctx: this.chart.ctx, options: this.options.legend, chart: this }); Chart.layoutService.addBox(this, this.legend); } }, updateLayout: function() { Chart.layoutService.update(this, this.chart.width, this.chart.height); }, buildOrUpdateControllers: function buildOrUpdateControllers() { var types = []; var newControllers = []; helpers.each(this.data.datasets, function(dataset, datasetIndex) { var meta = this.getDatasetMeta(datasetIndex); if (!meta.type) { meta.type = dataset.type || this.config.type; } types.push(meta.type); if (meta.controller) { meta.controller.updateIndex(datasetIndex); } else { meta.controller = new Chart.controllers[meta.type](this, datasetIndex); newControllers.push(meta.controller); } }, this); if (types.length > 1) { for (var i = 1; i < types.length; i++) { if (types[i] !== types[i - 1]) { this.isCombo = true; break; } } } return newControllers; }, resetElements: function resetElements() { helpers.each(this.data.datasets, function(dataset, datasetIndex) { this.getDatasetMeta(datasetIndex).controller.reset(); }, this); }, update: function update(animationDuration, lazy) { Chart.pluginService.notifyPlugins('beforeUpdate', [this]); // In case the entire data object changed this.tooltip._data = this.data; // Make sure dataset controllers are updated and new controllers are reset var newControllers = this.buildOrUpdateControllers(); // Make sure all dataset controllers have correct meta data counts helpers.each(this.data.datasets, function(dataset, datasetIndex) { this.getDatasetMeta(datasetIndex).controller.buildOrUpdateElements(); }, this); Chart.layoutService.update(this, this.chart.width, this.chart.height); // Can only reset the new controllers after the scales have been updated helpers.each(newControllers, function(controller) { controller.reset(); }); // This will loop through any data and do the appropriate element update for the type helpers.each(this.data.datasets, function(dataset, datasetIndex) { this.getDatasetMeta(datasetIndex).controller.update(); }, this); this.render(animationDuration, lazy); Chart.pluginService.notifyPlugins('afterUpdate', [this]); }, render: function render(duration, lazy) { Chart.pluginService.notifyPlugins('beforeRender', [this]); if (this.options.animation && ((typeof duration !== 'undefined' && duration !== 0) || (typeof duration === 'undefined' && this.options.animation.duration !== 0))) { var animation = new Chart.Animation(); animation.numSteps = (duration || this.options.animation.duration) / 16.66; //60 fps animation.easing = this.options.animation.easing; // render function animation.render = function(chartInstance, animationObject) { var easingFunction = helpers.easingEffects[animationObject.easing]; var stepDecimal = animationObject.currentStep / animationObject.numSteps; var easeDecimal = easingFunction(stepDecimal); chartInstance.draw(easeDecimal, stepDecimal, animationObject.currentStep); }; // user events animation.onAnimationProgress = this.options.animation.onProgress; animation.onAnimationComplete = this.options.animation.onComplete; Chart.animationService.addAnimation(this, animation, duration, lazy); } else { this.draw(); if (this.options.animation && this.options.animation.onComplete && this.options.animation.onComplete.call) { this.options.animation.onComplete.call(this); } } return this; }, draw: function(ease) { var easingDecimal = ease || 1; this.clear(); Chart.pluginService.notifyPlugins('beforeDraw', [this, easingDecimal]); // Draw all the scales helpers.each(this.boxes, function(box) { box.draw(this.chartArea); }, this); if (this.scale) { this.scale.draw(); } // Clip out the chart area so that anything outside does not draw. This is necessary for zoom and pan to function this.chart.ctx.save(); this.chart.ctx.beginPath(); this.chart.ctx.rect(this.chartArea.left, this.chartArea.top, this.chartArea.right - this.chartArea.left, this.chartArea.bottom - this.chartArea.top); this.chart.ctx.clip(); // Draw each dataset via its respective controller (reversed to support proper line stacking) helpers.each(this.data.datasets, function(dataset, datasetIndex) { if (this.isDatasetVisible(datasetIndex)) { this.getDatasetMeta(datasetIndex).controller.draw(ease); } }, this, true); // Restore from the clipping operation this.chart.ctx.restore(); // Finally draw the tooltip this.tooltip.transition(easingDecimal).draw(); Chart.pluginService.notifyPlugins('afterDraw', [this, easingDecimal]); }, // Get the single element that was clicked on // @return : An object containing the dataset index and element index of the matching element. Also contains the rectangle that was draw getElementAtEvent: function(e) { var eventPosition = helpers.getRelativePosition(e, this.chart); var elementsArray = []; helpers.each(this.data.datasets, function(dataset, datasetIndex) { if (this.isDatasetVisible(datasetIndex)) { var meta = this.getDatasetMeta(datasetIndex); helpers.each(meta.data, function(element, index) { if (element.inRange(eventPosition.x, eventPosition.y)) { elementsArray.push(element); return elementsArray; } }); } }, this); return elementsArray; }, getElementsAtEvent: function(e) { var eventPosition = helpers.getRelativePosition(e, this.chart); var elementsArray = []; var found = (function() { if (this.data.datasets) { for (var i = 0; i < this.data.datasets.length; i++) { var meta = this.getDatasetMeta(i); if (this.isDatasetVisible(i)) { for (var j = 0; j < meta.data.length; j++) { if (meta.data[j].inRange(eventPosition.x, eventPosition.y)) { return meta.data[j]; } } } } } }).call(this); if (!found) { return elementsArray; } helpers.each(this.data.datasets, function(dataset, datasetIndex) { if (this.isDatasetVisible(datasetIndex)) { var meta = this.getDatasetMeta(datasetIndex); elementsArray.push(meta.data[found._index]); } }, this); return elementsArray; }, getDatasetAtEvent: function(e) { var elementsArray = this.getElementAtEvent(e); if (elementsArray.length > 0) { elementsArray = this.getDatasetMeta(elementsArray[0]._datasetIndex).data; } return elementsArray; }, getDatasetMeta: function(datasetIndex) { var dataset = this.data.datasets[datasetIndex]; if (!dataset._meta) { dataset._meta = {}; } var meta = dataset._meta[this.id]; if (!meta) { meta = dataset._meta[this.id] = { type: null, data: [], dataset: null, controller: null, hidden: null, // See isDatasetVisible() comment xAxisID: null, yAxisID: null }; } return meta; }, getVisibleDatasetCount: function() { var count = 0; for (var i = 0, ilen = this.data.datasets.length; i<ilen; ++i) { if (this.isDatasetVisible(i)) { count++; } } return count; }, isDatasetVisible: function(datasetIndex) { var meta = this.getDatasetMeta(datasetIndex); // meta.hidden is a per chart dataset hidden flag override with 3 states: if true or false, // the dataset.hidden value is ignored, else if null, the dataset hidden state is returned. return typeof meta.hidden === 'boolean'? !meta.hidden : !this.data.datasets[datasetIndex].hidden; }, generateLegend: function generateLegend() { return this.options.legendCallback(this); }, destroy: function destroy() { this.clear(); helpers.unbindEvents(this, this.events); helpers.removeResizeListener(this.chart.canvas.parentNode); // Reset canvas height/width attributes var canvas = this.chart.canvas; canvas.width = this.chart.width; canvas.height = this.chart.height; // if we scaled the canvas in response to a devicePixelRatio !== 1, we need to undo that transform here if (this.chart.originalDevicePixelRatio !== undefined) { this.chart.ctx.scale(1 / this.chart.originalDevicePixelRatio, 1 / this.chart.originalDevicePixelRatio); } // Reset to the old style since it may have been changed by the device pixel ratio changes canvas.style.width = this.chart.originalCanvasStyleWidth; canvas.style.height = this.chart.originalCanvasStyleHeight; Chart.pluginService.notifyPlugins('destroy', [this]); delete Chart.instances[this.id]; }, toBase64Image: function toBase64Image() { return this.chart.canvas.toDataURL.apply(this.chart.canvas, arguments); }, initToolTip: function initToolTip() { this.tooltip = new Chart.Tooltip({ _chart: this.chart, _chartInstance: this, _data: this.data, _options: this.options }, this); }, bindEvents: function bindEvents() { helpers.bindEvents(this, this.options.events, function(evt) { this.eventHandler(evt); }); }, eventHandler: function eventHandler(e) { this.lastActive = this.lastActive || []; this.lastTooltipActive = this.lastTooltipActive || []; // Find Active Elements for hover and tooltips if (e.type === 'mouseout') { this.active = []; this.tooltipActive = []; } else { var _this = this; var getItemsForMode = function(mode) { switch (mode) { case 'single': return _this.getElementAtEvent(e); case 'label': return _this.getElementsAtEvent(e); case 'dataset': return _this.getDatasetAtEvent(e); default: return e; } }; this.active = getItemsForMode(this.options.hover.mode); this.tooltipActive = getItemsForMode(this.options.tooltips.mode); } // On Hover hook if (this.options.hover.onHover) { this.options.hover.onHover.call(this, this.active); } if (e.type === 'mouseup' || e.type === 'click') { if (this.options.onClick) { this.options.onClick.call(this, e, this.active); } if (this.legend && this.legend.handleEvent) { this.legend.handleEvent(e); } } // Remove styling for last active (even if it may still be active) if (this.lastActive.length) { switch (this.options.hover.mode) { case 'single': this.getDatasetMeta(this.lastActive[0]._datasetIndex).controller.removeHoverStyle(this.lastActive[0], this.lastActive[0]._datasetIndex, this.lastActive[0]._index); break; case 'label': case 'dataset': for (var i = 0; i < this.lastActive.length; i++) { if (this.lastActive[i]) this.getDatasetMeta(this.lastActive[i]._datasetIndex).controller.removeHoverStyle(this.lastActive[i], this.lastActive[i]._datasetIndex, this.lastActive[i]._index); } break; default: // Don't change anything } } // Built in hover styling if (this.active.length && this.options.hover.mode) { switch (this.options.hover.mode) { case 'single': this.getDatasetMeta(this.active[0]._datasetIndex).controller.setHoverStyle(this.active[0]); break; case 'label': case 'dataset': for (var j = 0; j < this.active.length; j++) { if (this.active[j]) this.getDatasetMeta(this.active[j]._datasetIndex).controller.setHoverStyle(this.active[j]); } break; default: // Don't change anything } } // Built in Tooltips if (this.options.tooltips.enabled || this.options.tooltips.custom) { // The usual updates this.tooltip.initialize(); this.tooltip._active = this.tooltipActive; this.tooltip.update(true); } // Hover animations this.tooltip.pivot(); if (!this.animating) { var changed; helpers.each(this.active, function(element, index) { if (element !== this.lastActive[index]) { changed = true; } }, this); helpers.each(this.tooltipActive, function(element, index) { if (element !== this.lastTooltipActive[index]) { changed = true; } }, this); // If entering, leaving, or changing elements, animate the change via pivot if ((this.lastActive.length !== this.active.length) || (this.lastTooltipActive.length !== this.tooltipActive.length) || changed) { this.stop(); if (this.options.tooltips.enabled || this.options.tooltips.custom) { this.tooltip.update(true); } // We only need to render at this point. Updating will cause scales to be recomputed generating flicker & using more // memory than necessary. this.render(this.options.hover.animationDuration, true); } } // Remember Last Actives this.lastActive = this.active; this.lastTooltipActive = this.tooltipActive; return this; } }); }; },{}],23:[function(require,module,exports){ "use strict"; module.exports = function(Chart) { var helpers = Chart.helpers; var noop = helpers.noop; // Base class for all dataset controllers (line, bar, etc) Chart.DatasetController = function(chart, datasetIndex) { this.initialize.call(this, chart, datasetIndex); }; helpers.extend(Chart.DatasetController.prototype, { initialize: function(chart, datasetIndex) { this.chart = chart; this.index = datasetIndex; this.linkScales(); this.addElements(); }, updateIndex: function(datasetIndex) { this.index = datasetIndex; }, linkScales: function() { var meta = this.getMeta(); var dataset = this.getDataset(); if (meta.xAxisID === null) { meta.xAxisID = dataset.xAxisID || this.chart.options.scales.xAxes[0].id; } if (meta.yAxisID === null) { meta.yAxisID = dataset.yAxisID || this.chart.options.scales.yAxes[0].id; } }, getDataset: function() { return this.chart.data.datasets[this.index]; }, getMeta: function() { return this.chart.getDatasetMeta(this.index); }, getScaleForId: function(scaleID) { return this.chart.scales[scaleID]; }, reset: function() { this.update(true); }, buildOrUpdateElements: function buildOrUpdateElements() { // Handle the number of data points changing var meta = this.getMeta(), md = meta.data, numData = this.getDataset().data.length, numMetaData = md.length; // Make sure that we handle number of datapoints changing if (numData < numMetaData) { // Remove excess bars for data points that have been removed md.splice(numData, numMetaData - numData); } else if (numData > numMetaData) { // Add new elements for (var index = numMetaData; index < numData; ++index) { this.addElementAndReset(index); } } }, // Controllers should implement the following addElements: noop, addElementAndReset: noop, draw: noop, removeHoverStyle: noop, setHoverStyle: noop, update: noop }); Chart.DatasetController.extend = helpers.inherits; }; },{}],24:[function(require,module,exports){ "use strict"; module.exports = function(Chart) { var helpers = Chart.helpers; Chart.elements = {}; Chart.Element = function(configuration) { helpers.extend(this, configuration); this.initialize.apply(this, arguments); }; helpers.extend(Chart.Element.prototype, { initialize: function() { this.hidden = false; }, pivot: function() { if (!this._view) { this._view = helpers.clone(this._model); } this._start = helpers.clone(this._view); return this; }, transition: function(ease) { if (!this._view) { this._view = helpers.clone(this._model); } // No animation -> No Transition if (ease === 1) { this._view = this._model; this._start = null; return this; } if (!this._start) { this.pivot(); } helpers.each(this._model, function(value, key) { if (key[0] === '_' || !this._model.hasOwnProperty(key)) { // Only non-underscored properties } // Init if doesn't exist else if (!this._view.hasOwnProperty(key)) { if (typeof value === 'number' && !isNaN(this._view[key])) { this._view[key] = value * ease; } else { this._view[key] = value; } } // No unnecessary computations else if (value === this._view[key]) { // It's the same! Woohoo! } // Color transitions if possible else if (typeof value === 'string') { try { var color = helpers.color(this._start[key]).mix(helpers.color(this._model[key]), ease); this._view[key] = color.rgbString(); } catch (err) { this._view[key] = value; } } // Number transitions else if (typeof value === 'number') { var startVal = this._start[key] !== undefined && isNaN(this._start[key]) === false ? this._start[key] : 0; this._view[key] = ((this._model[key] - startVal) * ease) + startVal; } // Everything else else { this._view[key] = value; } }, this); return this; }, tooltipPosition: function() { return { x: this._model.x, y: this._model.y }; }, hasValue: function() { return helpers.isNumber(this._model.x) && helpers.isNumber(this._model.y); } }); Chart.Element.extend = helpers.inherits; }; },{}],25:[function(require,module,exports){ /*global window: false */ /*global document: false */ "use strict"; var color = require('chartjs-color'); module.exports = function(Chart) { //Global Chart helpers object for utility methods and classes var helpers = Chart.helpers = {}; //-- Basic js utility methods helpers.each = function(loopable, callback, self, reverse) { // Check to see if null or undefined firstly. var i, len; if (helpers.isArray(loopable)) { len = loopable.length; if (reverse) { for (i = len - 1; i >= 0; i--) { callback.call(self, loopable[i], i); } } else { for (i = 0; i < len; i++) { callback.call(self, loopable[i], i); } } } else if (typeof loopable === 'object') { var keys = Object.keys(loopable); len = keys.length; for (i = 0; i < len; i++) { callback.call(self, loopable[keys[i]], keys[i]); } } }; helpers.clone = function(obj) { var objClone = {}; helpers.each(obj, function(value, key) { if (obj.hasOwnProperty(key)) { if (helpers.isArray(value)) { objClone[key] = value.slice(0); } else if (typeof value === 'object' && value !== null) { objClone[key] = helpers.clone(value); } else { objClone[key] = value; } } }); return objClone; }; helpers.extend = function(base) { var len = arguments.length; var additionalArgs = []; for (var i = 1; i < len; i++) { additionalArgs.push(arguments[i]); } helpers.each(additionalArgs, function(extensionObject) { helpers.each(extensionObject, function(value, key) { if (extensionObject.hasOwnProperty(key)) { base[key] = value; } }); }); return base; }; // Need a special merge function to chart configs since they are now grouped helpers.configMerge = function(_base) { var base = helpers.clone(_base); helpers.each(Array.prototype.slice.call(arguments, 1), function(extension) { helpers.each(extension, function(value, key) { if (extension.hasOwnProperty(key)) { if (key === 'scales') { // Scale config merging is complex. Add out own function here for that base[key] = helpers.scaleMerge(base.hasOwnProperty(key) ? base[key] : {}, value); } else if (key === 'scale') { // Used in polar area & radar charts since there is only one scale base[key] = helpers.configMerge(base.hasOwnProperty(key) ? base[key] : {}, Chart.scaleService.getScaleDefaults(value.type), value); } else if (base.hasOwnProperty(key) && helpers.isArray(base[key]) && helpers.isArray(value)) { // In this case we have an array of objects replacing another array. Rather than doing a strict replace, // merge. This allows easy scale option merging var baseArray = base[key]; helpers.each(value, function(valueObj, index) { if (index < baseArray.length) { if (typeof baseArray[index] === 'object' && baseArray[index] !== null && typeof valueObj === 'object' && valueObj !== null) { // Two objects are coming together. Do a merge of them. baseArray[index] = helpers.configMerge(baseArray[index], valueObj); } else { // Just overwrite in this case since there is nothing to merge baseArray[index] = valueObj; } } else { baseArray.push(valueObj); // nothing to merge } }); } else if (base.hasOwnProperty(key) && typeof base[key] === "object" && base[key] !== null && typeof value === "object") { // If we are overwriting an object with an object, do a merge of the properties. base[key] = helpers.configMerge(base[key], value); } else { // can just overwrite the value in this case base[key] = value; } } }); }); return base; }; helpers.extendDeep = function(_base) { return _extendDeep.apply(this, arguments); function _extendDeep(dst) { helpers.each(arguments, function(obj) { if (obj !== dst) { helpers.each(obj, function(value, key) { if (dst[key] && dst[key].constructor && dst[key].constructor === Object) { _extendDeep(dst[key], value); } else { dst[key] = value; } }); } }); return dst; } }; helpers.scaleMerge = function(_base, extension) { var base = helpers.clone(_base); helpers.each(extension, function(value, key) { if (extension.hasOwnProperty(key)) { if (key === 'xAxes' || key === 'yAxes') { // These properties are arrays of items if (base.hasOwnProperty(key)) { helpers.each(value, function(valueObj, index) { var axisType = helpers.getValueOrDefault(valueObj.type, key === 'xAxes' ? 'category' : 'linear'); var axisDefaults = Chart.scaleService.getScaleDefaults(axisType); if (index >= base[key].length || !base[key][index].type) { base[key].push(helpers.configMerge(axisDefaults, valueObj)); } else if (valueObj.type && valueObj.type !== base[key][index].type) { // Type changed. Bring in the new defaults before we bring in valueObj so that valueObj can override the correct scale defaults base[key][index] = helpers.configMerge(base[key][index], axisDefaults, valueObj); } else { // Type is the same base[key][index] = helpers.configMerge(base[key][index], valueObj); } }); } else { base[key] = []; helpers.each(value, function(valueObj) { var axisType = helpers.getValueOrDefault(valueObj.type, key === 'xAxes' ? 'category' : 'linear'); base[key].push(helpers.configMerge(Chart.scaleService.getScaleDefaults(axisType), valueObj)); }); } } else if (base.hasOwnProperty(key) && typeof base[key] === "object" && base[key] !== null && typeof value === "object") { // If we are overwriting an object with an object, do a merge of the properties. base[key] = helpers.configMerge(base[key], value); } else { // can just overwrite the value in this case base[key] = value; } } }); return base; }; helpers.getValueAtIndexOrDefault = function(value, index, defaultValue) { if (value === undefined || value === null) { return defaultValue; } if (helpers.isArray(value)) { return index < value.length ? value[index] : defaultValue; } return value; }; helpers.getValueOrDefault = function(value, defaultValue) { return value === undefined ? defaultValue : value; }; helpers.indexOf = function(arrayToSearch, item) { if (Array.prototype.indexOf) { return arrayToSearch.indexOf(item); } else { for (var i = 0; i < arrayToSearch.length; i++) { if (arrayToSearch[i] === item) return i; } return -1; } }; helpers.where = function(collection, filterCallback) { var filtered = []; helpers.each(collection, function(item) { if (filterCallback(item)) { filtered.push(item); } }); return filtered; }; helpers.findIndex = function(arrayToSearch, callback, thisArg) { var index = -1; if (Array.prototype.findIndex) { index = arrayToSearch.findIndex(callback, thisArg); } else { for (var i = 0; i < arrayToSearch.length; ++i) { thisArg = thisArg !== undefined ? thisArg : arrayToSearch; if (callback.call(thisArg, arrayToSearch[i], i, arrayToSearch)) { index = i; break; } } } return index; }; helpers.findNextWhere = function(arrayToSearch, filterCallback, startIndex) { // Default to start of the array if (startIndex === undefined || startIndex === null) { startIndex = -1; } for (var i = startIndex + 1; i < arrayToSearch.length; i++) { var currentItem = arrayToSearch[i]; if (filterCallback(currentItem)) { return currentItem; } } }; helpers.findPreviousWhere = function(arrayToSearch, filterCallback, startIndex) { // Default to end of the array if (startIndex === undefined || startIndex === null) { startIndex = arrayToSearch.length; } for (var i = startIndex - 1; i >= 0; i--) { var currentItem = arrayToSearch[i]; if (filterCallback(currentItem)) { return currentItem; } } }; helpers.inherits = function(extensions) { //Basic javascript inheritance based on the model created in Backbone.js var parent = this; var ChartElement = (extensions && extensions.hasOwnProperty("constructor")) ? extensions.constructor : function() { return parent.apply(this, arguments); }; var Surrogate = function() { this.constructor = ChartElement; }; Surrogate.prototype = parent.prototype; ChartElement.prototype = new Surrogate(); ChartElement.extend = helpers.inherits; if (extensions) { helpers.extend(ChartElement.prototype, extensions); } ChartElement.__super__ = parent.prototype; return ChartElement; }; helpers.noop = function() {}; helpers.uid = (function() { var id = 0; return function() { return id++; }; })(); helpers.warn = function(str) { //Method for warning of errors if (console && typeof console.warn === "function") { console.warn(str); } }; //-- Math methods helpers.isNumber = function(n) { return !isNaN(parseFloat(n)) && isFinite(n); }; helpers.almostEquals = function(x, y, epsilon) { return Math.abs(x - y) < epsilon; }; helpers.max = function(array) { return array.reduce(function(max, value) { if (!isNaN(value)) { return Math.max(max, value); } else { return max; } }, Number.NEGATIVE_INFINITY); }; helpers.min = function(array) { return array.reduce(function(min, value) { if (!isNaN(value)) { return Math.min(min, value); } else { return min; } }, Number.POSITIVE_INFINITY); }; helpers.sign = function(x) { if (Math.sign) { return Math.sign(x); } else { x = +x; // convert to a number if (x === 0 || isNaN(x)) { return x; } return x > 0 ? 1 : -1; } }; helpers.log10 = function(x) { if (Math.log10) { return Math.log10(x); } else { return Math.log(x) / Math.LN10; } }; helpers.toRadians = function(degrees) { return degrees * (Math.PI / 180); }; helpers.toDegrees = function(radians) { return radians * (180 / Math.PI); }; // Gets the angle from vertical upright to the point about a centre. helpers.getAngleFromPoint = function(centrePoint, anglePoint) { var distanceFromXCenter = anglePoint.x - centrePoint.x, distanceFromYCenter = anglePoint.y - centrePoint.y, radialDistanceFromCenter = Math.sqrt(distanceFromXCenter * distanceFromXCenter + distanceFromYCenter * distanceFromYCenter); var angle = Math.atan2(distanceFromYCenter, distanceFromXCenter); if (angle < (-0.5 * Math.PI)) { angle += 2.0 * Math.PI; // make sure the returned angle is in the range of (-PI/2, 3PI/2] } return { angle: angle, distance: radialDistanceFromCenter }; }; helpers.aliasPixel = function(pixelWidth) { return (pixelWidth % 2 === 0) ? 0 : 0.5; }; helpers.splineCurve = function(firstPoint, middlePoint, afterPoint, t) { //Props to Rob Spencer at scaled innovation for his post on splining between points //http://scaledinnovation.com/analytics/splines/aboutSplines.html // This function must also respect "skipped" points var previous = firstPoint.skip ? middlePoint : firstPoint, current = middlePoint, next = afterPoint.skip ? middlePoint : afterPoint; var d01 = Math.sqrt(Math.pow(current.x - previous.x, 2) + Math.pow(current.y - previous.y, 2)); var d12 = Math.sqrt(Math.pow(next.x - current.x, 2) + Math.pow(next.y - current.y, 2)); var s01 = d01 / (d01 + d12); var s12 = d12 / (d01 + d12); // If all points are the same, s01 & s02 will be inf s01 = isNaN(s01) ? 0 : s01; s12 = isNaN(s12) ? 0 : s12; var fa = t * s01; // scaling factor for triangle Ta var fb = t * s12; return { previous: { x: current.x - fa * (next.x - previous.x), y: current.y - fa * (next.y - previous.y) }, next: { x: current.x + fb * (next.x - previous.x), y: current.y + fb * (next.y - previous.y) } }; }; helpers.nextItem = function(collection, index, loop) { if (loop) { return index >= collection.length - 1 ? collection[0] : collection[index + 1]; } return index >= collection.length - 1 ? collection[collection.length - 1] : collection[index + 1]; }; helpers.previousItem = function(collection, index, loop) { if (loop) { return index <= 0 ? collection[collection.length - 1] : collection[index - 1]; } return index <= 0 ? collection[0] : collection[index - 1]; }; // Implementation of the nice number algorithm used in determining where axis labels will go helpers.niceNum = function(range, round) { var exponent = Math.floor(helpers.log10(range)); var fraction = range / Math.pow(10, exponent); var niceFraction; if (round) { if (fraction < 1.5) { niceFraction = 1; } else if (fraction < 3) { niceFraction = 2; } else if (fraction < 7) { niceFraction = 5; } else { niceFraction = 10; } } else { if (fraction <= 1.0) { niceFraction = 1; } else if (fraction <= 2) { niceFraction = 2; } else if (fraction <= 5) { niceFraction = 5; } else { niceFraction = 10; } } return niceFraction * Math.pow(10, exponent); }; //Easing functions adapted from Robert Penner's easing equations //http://www.robertpenner.com/easing/ var easingEffects = helpers.easingEffects = { linear: function(t) { return t; }, easeInQuad: function(t) { return t * t; }, easeOutQuad: function(t) { return -1 * t * (t - 2); }, easeInOutQuad: function(t) { if ((t /= 1 / 2) < 1) { return 1 / 2 * t * t; } return -1 / 2 * ((--t) * (t - 2) - 1); }, easeInCubic: function(t) { return t * t * t; }, easeOutCubic: function(t) { return 1 * ((t = t / 1 - 1) * t * t + 1); }, easeInOutCubic: function(t) { if ((t /= 1 / 2) < 1) { return 1 / 2 * t * t * t; } return 1 / 2 * ((t -= 2) * t * t + 2); }, easeInQuart: function(t) { return t * t * t * t; }, easeOutQuart: function(t) { return -1 * ((t = t / 1 - 1) * t * t * t - 1); }, easeInOutQuart: function(t) { if ((t /= 1 / 2) < 1) { return 1 / 2 * t * t * t * t; } return -1 / 2 * ((t -= 2) * t * t * t - 2); }, easeInQuint: function(t) { return 1 * (t /= 1) * t * t * t * t; }, easeOutQuint: function(t) { return 1 * ((t = t / 1 - 1) * t * t * t * t + 1); }, easeInOutQuint: function(t) { if ((t /= 1 / 2) < 1) { return 1 / 2 * t * t * t * t * t; } return 1 / 2 * ((t -= 2) * t * t * t * t + 2); }, easeInSine: function(t) { return -1 * Math.cos(t / 1 * (Math.PI / 2)) + 1; }, easeOutSine: function(t) { return 1 * Math.sin(t / 1 * (Math.PI / 2)); }, easeInOutSine: function(t) { return -1 / 2 * (Math.cos(Math.PI * t / 1) - 1); }, easeInExpo: function(t) { return (t === 0) ? 1 : 1 * Math.pow(2, 10 * (t / 1 - 1)); }, easeOutExpo: function(t) { return (t === 1) ? 1 : 1 * (-Math.pow(2, -10 * t / 1) + 1); }, easeInOutExpo: function(t) { if (t === 0) { return 0; } if (t === 1) { return 1; } if ((t /= 1 / 2) < 1) { return 1 / 2 * Math.pow(2, 10 * (t - 1)); } return 1 / 2 * (-Math.pow(2, -10 * --t) + 2); }, easeInCirc: function(t) { if (t >= 1) { return t; } return -1 * (Math.sqrt(1 - (t /= 1) * t) - 1); }, easeOutCirc: function(t) { return 1 * Math.sqrt(1 - (t = t / 1 - 1) * t); }, easeInOutCirc: function(t) { if ((t /= 1 / 2) < 1) { return -1 / 2 * (Math.sqrt(1 - t * t) - 1); } return 1 / 2 * (Math.sqrt(1 - (t -= 2) * t) + 1); }, easeInElastic: function(t) { var s = 1.70158; var p = 0; var a = 1; if (t === 0) { return 0; } if ((t /= 1) === 1) { return 1; } if (!p) { p = 1 * 0.3; } if (a < Math.abs(1)) { a = 1; s = p / 4; } else { s = p / (2 * Math.PI) * Math.asin(1 / a); } return -(a * Math.pow(2, 10 * (t -= 1)) * Math.sin((t * 1 - s) * (2 * Math.PI) / p)); }, easeOutElastic: function(t) { var s = 1.70158; var p = 0; var a = 1; if (t === 0) { return 0; } if ((t /= 1) === 1) { return 1; } if (!p) { p = 1 * 0.3; } if (a < Math.abs(1)) { a = 1; s = p / 4; } else { s = p / (2 * Math.PI) * Math.asin(1 / a); } return a * Math.pow(2, -10 * t) * Math.sin((t * 1 - s) * (2 * Math.PI) / p) + 1; }, easeInOutElastic: function(t) { var s = 1.70158; var p = 0; var a = 1; if (t === 0) { return 0; } if ((t /= 1 / 2) === 2) { return 1; } if (!p) { p = 1 * (0.3 * 1.5); } if (a < Math.abs(1)) { a = 1; s = p / 4; } else { s = p / (2 * Math.PI) * Math.asin(1 / a); } if (t < 1) { return -0.5 * (a * Math.pow(2, 10 * (t -= 1)) * Math.sin((t * 1 - s) * (2 * Math.PI) / p)); } return a * Math.pow(2, -10 * (t -= 1)) * Math.sin((t * 1 - s) * (2 * Math.PI) / p) * 0.5 + 1; }, easeInBack: function(t) { var s = 1.70158; return 1 * (t /= 1) * t * ((s + 1) * t - s); }, easeOutBack: function(t) { var s = 1.70158; return 1 * ((t = t / 1 - 1) * t * ((s + 1) * t + s) + 1); }, easeInOutBack: function(t) { var s = 1.70158; if ((t /= 1 / 2) < 1) { return 1 / 2 * (t * t * (((s *= (1.525)) + 1) * t - s)); } return 1 / 2 * ((t -= 2) * t * (((s *= (1.525)) + 1) * t + s) + 2); }, easeInBounce: function(t) { return 1 - easingEffects.easeOutBounce(1 - t); }, easeOutBounce: function(t) { if ((t /= 1) < (1 / 2.75)) { return 1 * (7.5625 * t * t); } else if (t < (2 / 2.75)) { return 1 * (7.5625 * (t -= (1.5 / 2.75)) * t + 0.75); } else if (t < (2.5 / 2.75)) { return 1 * (7.5625 * (t -= (2.25 / 2.75)) * t + 0.9375); } else { return 1 * (7.5625 * (t -= (2.625 / 2.75)) * t + 0.984375); } }, easeInOutBounce: function(t) { if (t < 1 / 2) { return easingEffects.easeInBounce(t * 2) * 0.5; } return easingEffects.easeOutBounce(t * 2 - 1) * 0.5 + 1 * 0.5; } }; //Request animation polyfill - http://www.paulirish.com/2011/requestanimationframe-for-smart-animating/ helpers.requestAnimFrame = (function() { return window.requestAnimationFrame || window.webkitRequestAnimationFrame || window.mozRequestAnimationFrame || window.oRequestAnimationFrame || window.msRequestAnimationFrame || function(callback) { return window.setTimeout(callback, 1000 / 60); }; })(); helpers.cancelAnimFrame = (function() { return window.cancelAnimationFrame || window.webkitCancelAnimationFrame || window.mozCancelAnimationFrame || window.oCancelAnimationFrame || window.msCancelAnimationFrame || function(callback) { return window.clearTimeout(callback, 1000 / 60); }; })(); //-- DOM methods helpers.getRelativePosition = function(evt, chart) { var mouseX, mouseY; var e = evt.originalEvent || evt, canvas = evt.currentTarget || evt.srcElement, boundingRect = canvas.getBoundingClientRect(); if (e.touches && e.touches.length > 0) { mouseX = e.touches[0].clientX; mouseY = e.touches[0].clientY; } else { mouseX = e.clientX; mouseY = e.clientY; } // Scale mouse coordinates into canvas coordinates // by following the pattern laid out by 'jerryj' in the comments of // http://www.html5canvastutorials.com/advanced/html5-canvas-mouse-coordinates/ var paddingLeft = parseFloat(helpers.getStyle(canvas, 'padding-left')); var paddingTop = parseFloat(helpers.getStyle(canvas, 'padding-top')); var paddingRight = parseFloat(helpers.getStyle(canvas, 'padding-right')); var paddingBottom = parseFloat(helpers.getStyle(canvas, 'padding-bottom')); var width = boundingRect.right - boundingRect.left - paddingLeft - paddingRight; var height = boundingRect.bottom - boundingRect.top - paddingTop - paddingBottom; // We divide by the current device pixel ratio, because the canvas is scaled up by that amount in each direction. However // the backend model is in unscaled coordinates. Since we are going to deal with our model coordinates, we go back here mouseX = Math.round((mouseX - boundingRect.left - paddingLeft) / (width) * canvas.width / chart.currentDevicePixelRatio); mouseY = Math.round((mouseY - boundingRect.top - paddingTop) / (height) * canvas.height / chart.currentDevicePixelRatio); return { x: mouseX, y: mouseY }; }; helpers.addEvent = function(node, eventType, method) { if (node.addEventListener) { node.addEventListener(eventType, method); } else if (node.attachEvent) { node.attachEvent("on" + eventType, method); } else { node["on" + eventType] = method; } }; helpers.removeEvent = function(node, eventType, handler) { if (node.removeEventListener) { node.removeEventListener(eventType, handler, false); } else if (node.detachEvent) { node.detachEvent("on" + eventType, handler); } else { node["on" + eventType] = helpers.noop; } }; helpers.bindEvents = function(chartInstance, arrayOfEvents, handler) { // Create the events object if it's not already present if (!chartInstance.events) chartInstance.events = {}; helpers.each(arrayOfEvents, function(eventName) { chartInstance.events[eventName] = function() { handler.apply(chartInstance, arguments); }; helpers.addEvent(chartInstance.chart.canvas, eventName, chartInstance.events[eventName]); }); }; helpers.unbindEvents = function(chartInstance, arrayOfEvents) { helpers.each(arrayOfEvents, function(handler, eventName) { helpers.removeEvent(chartInstance.chart.canvas, eventName, handler); }); }; // Private helper function to convert max-width/max-height values that may be percentages into a number function parseMaxStyle(styleValue, node, parentProperty) { var valueInPixels; if (typeof(styleValue) === 'string') { valueInPixels = parseInt(styleValue, 10); if (styleValue.indexOf('%') != -1) { // percentage * size in dimension valueInPixels = valueInPixels / 100 * node.parentNode[parentProperty]; } } else { valueInPixels = styleValue; } return valueInPixels; } // Private helper to get a constraint dimension // @param domNode : the node to check the constraint on // @param maxStyle : the style that defines the maximum for the direction we are using (max-width / max-height) // @param percentageProperty : property of parent to use when calculating width as a percentage function getConstraintDimension(domNode, maxStyle, percentageProperty) { var constrainedDimension; var constrainedNode = document.defaultView.getComputedStyle(domNode)[maxStyle]; var constrainedContainer = document.defaultView.getComputedStyle(domNode.parentNode)[maxStyle]; var hasCNode = constrainedNode !== null && constrainedNode !== "none"; var hasCContainer = constrainedContainer !== null && constrainedContainer !== "none"; if (hasCNode || hasCContainer) { constrainedDimension = Math.min((hasCNode ? parseMaxStyle(constrainedNode, domNode, percentageProperty) : Number.POSITIVE_INFINITY), (hasCContainer ? parseMaxStyle(constrainedContainer, domNode.parentNode, percentageProperty) : Number.POSITIVE_INFINITY)); } return constrainedDimension; } // returns Number or undefined if no constraint helpers.getConstraintWidth = function(domNode) { return getConstraintDimension(domNode, 'max-width', 'clientWidth'); }; // returns Number or undefined if no constraint helpers.getConstraintHeight = function(domNode) { return getConstraintDimension(domNode, 'max-height', 'clientHeight'); }; helpers.getMaximumWidth = function(domNode) { var container = domNode.parentNode; var padding = parseInt(helpers.getStyle(container, 'padding-left')) + parseInt(helpers.getStyle(container, 'padding-right')); var w = container.clientWidth - padding; var cw = helpers.getConstraintWidth(domNode); if (cw !== undefined) { w = Math.min(w, cw); } return w; }; helpers.getMaximumHeight = function(domNode) { var container = domNode.parentNode; var padding = parseInt(helpers.getStyle(container, 'padding-top')) + parseInt(helpers.getStyle(container, 'padding-bottom')); var h = container.clientHeight - padding; var ch = helpers.getConstraintHeight(domNode); if (ch !== undefined) { h = Math.min(h, ch); } return h; }; helpers.getStyle = function(el, property) { return el.currentStyle ? el.currentStyle[property] : document.defaultView.getComputedStyle(el, null).getPropertyValue(property); }; helpers.retinaScale = function(chart) { var ctx = chart.ctx; var width = chart.canvas.width; var height = chart.canvas.height; var pixelRatio = chart.currentDevicePixelRatio = window.devicePixelRatio || 1; if (pixelRatio !== 1) { ctx.canvas.height = height * pixelRatio; ctx.canvas.width = width * pixelRatio; ctx.scale(pixelRatio, pixelRatio); // Store the device pixel ratio so that we can go backwards in `destroy`. // The devicePixelRatio changes with zoom, so there are no guarantees that it is the same // when destroy is called chart.originalDevicePixelRatio = chart.originalDevicePixelRatio || pixelRatio; } ctx.canvas.style.width = width + 'px'; ctx.canvas.style.height = height + 'px'; }; //-- Canvas methods helpers.clear = function(chart) { chart.ctx.clearRect(0, 0, chart.width, chart.height); }; helpers.fontString = function(pixelSize, fontStyle, fontFamily) { return fontStyle + " " + pixelSize + "px " + fontFamily; }; helpers.longestText = function(ctx, font, arrayOfStrings, cache) { cache = cache || {}; cache.data = cache.data || {}; cache.garbageCollect = cache.garbageCollect || []; if (cache.font !== font) { cache.data = {}; cache.garbageCollect = []; cache.font = font; } ctx.font = font; var longest = 0; helpers.each(arrayOfStrings, function(string) { // Undefined strings should not be measured if (string !== undefined && string !== null) { var textWidth = cache.data[string]; if (!textWidth) { textWidth = cache.data[string] = ctx.measureText(string).width; cache.garbageCollect.push(string); } if (textWidth > longest) { longest = textWidth; } } }); var gcLen = cache.garbageCollect.length / 2; if (gcLen > arrayOfStrings.length) { for (var i = 0; i < gcLen; i++) { delete cache.data[cache.garbageCollect[i]]; } cache.garbageCollect.splice(0, gcLen); } return longest; }; helpers.drawRoundedRectangle = function(ctx, x, y, width, height, radius) { ctx.beginPath(); ctx.moveTo(x + radius, y); ctx.lineTo(x + width - radius, y); ctx.quadraticCurveTo(x + width, y, x + width, y + radius); ctx.lineTo(x + width, y + height - radius); ctx.quadraticCurveTo(x + width, y + height, x + width - radius, y + height); ctx.lineTo(x + radius, y + height); ctx.quadraticCurveTo(x, y + height, x, y + height - radius); ctx.lineTo(x, y + radius); ctx.quadraticCurveTo(x, y, x + radius, y); ctx.closePath(); }; helpers.color = function(c) { if (!color) { console.log('Color.js not found!'); return c; } /* global CanvasGradient */ if (c instanceof CanvasGradient) { return color(Chart.defaults.global.defaultColor); } return color(c); }; helpers.addResizeListener = function(node, callback) { // Hide an iframe before the node var hiddenIframe = document.createElement('iframe'); var hiddenIframeClass = 'chartjs-hidden-iframe'; if (hiddenIframe.classlist) { // can use classlist hiddenIframe.classlist.add(hiddenIframeClass); } else { hiddenIframe.setAttribute('class', hiddenIframeClass); } // Set the style hiddenIframe.style.width = '100%'; hiddenIframe.style.display = 'block'; hiddenIframe.style.border = 0; hiddenIframe.style.height = 0; hiddenIframe.style.margin = 0; hiddenIframe.style.position = 'absolute'; hiddenIframe.style.left = 0; hiddenIframe.style.right = 0; hiddenIframe.style.top = 0; hiddenIframe.style.bottom = 0; // Insert the iframe so that contentWindow is available node.insertBefore(hiddenIframe, node.firstChild); (hiddenIframe.contentWindow || hiddenIframe).onresize = function() { if (callback) { callback(); } }; }; helpers.removeResizeListener = function(node) { var hiddenIframe = node.querySelector('.chartjs-hidden-iframe'); // Remove the resize detect iframe if (hiddenIframe) { hiddenIframe.parentNode.removeChild(hiddenIframe); } }; helpers.isArray = function(obj) { if (!Array.isArray) { return Object.prototype.toString.call(obj) === '[object Array]'; } return Array.isArray(obj); }; helpers.pushAllIfDefined = function(element, array) { if (typeof element === "undefined") { return; } if (helpers.isArray(element)) { array.push.apply(array, element); } else { array.push(element); } }; helpers.callCallback = function(fn, args, _tArg) { if (fn && typeof fn.call === 'function') { fn.apply(_tArg, args); } }; }; },{"chartjs-color":3}],26:[function(require,module,exports){ "use strict"; module.exports = function() { //Occupy the global variable of Chart, and create a simple base class var Chart = function(context, config) { this.config = config; // Support a jQuery'd canvas element if (context.length && context[0].getContext) { context = context[0]; } // Support a canvas domnode if (context.getContext) { context = context.getContext("2d"); } this.ctx = context; this.canvas = context.canvas; // Figure out what the size of the chart will be. // If the canvas has a specified width and height, we use those else // we look to see if the canvas node has a CSS width and height. // If there is still no height, fill the parent container this.width = context.canvas.width || parseInt(Chart.helpers.getStyle(context.canvas, 'width')) || Chart.helpers.getMaximumWidth(context.canvas); this.height = context.canvas.height || parseInt(Chart.helpers.getStyle(context.canvas, 'height')) || Chart.helpers.getMaximumHeight(context.canvas); this.aspectRatio = this.width / this.height; if (isNaN(this.aspectRatio) || isFinite(this.aspectRatio) === false) { // If the canvas has no size, try and figure out what the aspect ratio will be. // Some charts prefer square canvases (pie, radar, etc). If that is specified, use that // else use the canvas default ratio of 2 this.aspectRatio = config.aspectRatio !== undefined ? config.aspectRatio : 2; } // Store the original style of the element so we can set it back this.originalCanvasStyleWidth = context.canvas.style.width; this.originalCanvasStyleHeight = context.canvas.style.height; // High pixel density displays - multiply the size of the canvas height/width by the device pixel ratio, then scale. Chart.helpers.retinaScale(this); if (config) { this.controller = new Chart.Controller(this); } // Always bind this so that if the responsive state changes we still work var _this = this; Chart.helpers.addResizeListener(context.canvas.parentNode, function() { if (_this.controller && _this.controller.config.options.responsive) { _this.controller.resize(); } }); return this.controller ? this.controller : this; }; //Globally expose the defaults to allow for user updating/changing Chart.defaults = { global: { responsive: true, responsiveAnimationDuration: 0, maintainAspectRatio: true, events: ["mousemove", "mouseout", "click", "touchstart", "touchmove"], hover: { onHover: null, mode: 'single', animationDuration: 400 }, onClick: null, defaultColor: 'rgba(0,0,0,0.1)', defaultFontColor: '#666', defaultFontFamily: "'Helvetica Neue', 'Helvetica', 'Arial', sans-serif", defaultFontSize: 12, defaultFontStyle: 'normal', showLines: true, // Element defaults defined in element extensions elements: {}, // Legend callback string legendCallback: function(chart) { var text = []; text.push('<ul class="' + chart.id + '-legend">'); for (var i = 0; i < chart.data.datasets.length; i++) { text.push('<li><span style="background-color:' + chart.data.datasets[i].backgroundColor + '"></span>'); if (chart.data.datasets[i].label) { text.push(chart.data.datasets[i].label); } text.push('</li>'); } text.push('</ul>'); return text.join(""); } } }; return Chart; }; },{}],27:[function(require,module,exports){ "use strict"; module.exports = function(Chart) { var helpers = Chart.helpers; // The layout service is very self explanatory. It's responsible for the layout within a chart. // Scales, Legends and Plugins all rely on the layout service and can easily register to be placed anywhere they need // It is this service's responsibility of carrying out that layout. Chart.layoutService = { defaults: {}, // Register a box to a chartInstance. A box is simply a reference to an object that requires layout. eg. Scales, Legend, Plugins. addBox: function(chartInstance, box) { if (!chartInstance.boxes) { chartInstance.boxes = []; } chartInstance.boxes.push(box); }, removeBox: function(chartInstance, box) { if (!chartInstance.boxes) { return; } chartInstance.boxes.splice(chartInstance.boxes.indexOf(box), 1); }, // The most important function update: function(chartInstance, width, height) { if (!chartInstance) { return; } var xPadding = 0; var yPadding = 0; var leftBoxes = helpers.where(chartInstance.boxes, function(box) { return box.options.position === "left"; }); var rightBoxes = helpers.where(chartInstance.boxes, function(box) { return box.options.position === "right"; }); var topBoxes = helpers.where(chartInstance.boxes, function(box) { return box.options.position === "top"; }); var bottomBoxes = helpers.where(chartInstance.boxes, function(box) { return box.options.position === "bottom"; }); // Boxes that overlay the chartarea such as the radialLinear scale var chartAreaBoxes = helpers.where(chartInstance.boxes, function(box) { return box.options.position === "chartArea"; }); // Ensure that full width boxes are at the very top / bottom topBoxes.sort(function(a, b) { return (b.options.fullWidth ? 1 : 0) - (a.options.fullWidth ? 1 : 0); }); bottomBoxes.sort(function(a, b) { return (a.options.fullWidth ? 1 : 0) - (b.options.fullWidth ? 1 : 0); }); // Essentially we now have any number of boxes on each of the 4 sides. // Our canvas looks like the following. // The areas L1 and L2 are the left axes. R1 is the right axis, T1 is the top axis and // B1 is the bottom axis // There are also 4 quadrant-like locations (left to right instead of clockwise) reserved for chart overlays // These locations are single-box locations only, when trying to register a chartArea location that is already taken, // an error will be thrown. // // |----------------------------------------------------| // | T1 (Full Width) | // |----------------------------------------------------| // | | | T2 | | // | |----|-------------------------------------|----| // | | | C1 | | C2 | | // | | |----| |----| | // | | | | | // | L1 | L2 | ChartArea (C0) | R1 | // | | | | | // | | |----| |----| | // | | | C3 | | C4 | | // | |----|-------------------------------------|----| // | | | B1 | | // |----------------------------------------------------| // | B2 (Full Width) | // |----------------------------------------------------| // // What we do to find the best sizing, we do the following // 1. Determine the minimum size of the chart area. // 2. Split the remaining width equally between each vertical axis // 3. Split the remaining height equally between each horizontal axis // 4. Give each layout the maximum size it can be. The layout will return it's minimum size // 5. Adjust the sizes of each axis based on it's minimum reported size. // 6. Refit each axis // 7. Position each axis in the final location // 8. Tell the chart the final location of the chart area // 9. Tell any axes that overlay the chart area the positions of the chart area // Step 1 var chartWidth = width - (2 * xPadding); var chartHeight = height - (2 * yPadding); var chartAreaWidth = chartWidth / 2; // min 50% var chartAreaHeight = chartHeight / 2; // min 50% // Step 2 var verticalBoxWidth = (width - chartAreaWidth) / (leftBoxes.length + rightBoxes.length); // Step 3 var horizontalBoxHeight = (height - chartAreaHeight) / (topBoxes.length + bottomBoxes.length); // Step 4 var maxChartAreaWidth = chartWidth; var maxChartAreaHeight = chartHeight; var minBoxSizes = []; helpers.each(leftBoxes.concat(rightBoxes, topBoxes, bottomBoxes), getMinimumBoxSize); function getMinimumBoxSize(box) { var minSize; var isHorizontal = box.isHorizontal(); if (isHorizontal) { minSize = box.update(box.options.fullWidth ? chartWidth : maxChartAreaWidth, horizontalBoxHeight); maxChartAreaHeight -= minSize.height; } else { minSize = box.update(verticalBoxWidth, chartAreaHeight); maxChartAreaWidth -= minSize.width; } minBoxSizes.push({ horizontal: isHorizontal, minSize: minSize, box: box }); } // At this point, maxChartAreaHeight and maxChartAreaWidth are the size the chart area could // be if the axes are drawn at their minimum sizes. // Steps 5 & 6 var totalLeftBoxesWidth = xPadding; var totalRightBoxesWidth = xPadding; var totalTopBoxesHeight = yPadding; var totalBottomBoxesHeight = yPadding; // Update, and calculate the left and right margins for the horizontal boxes helpers.each(leftBoxes.concat(rightBoxes), fitBox); helpers.each(leftBoxes, function(box) { totalLeftBoxesWidth += box.width; }); helpers.each(rightBoxes, function(box) { totalRightBoxesWidth += box.width; }); // Set the Left and Right margins for the horizontal boxes helpers.each(topBoxes.concat(bottomBoxes), fitBox); // Function to fit a box function fitBox(box) { var minBoxSize = helpers.findNextWhere(minBoxSizes, function(minBoxSize) { return minBoxSize.box === box; }); if (minBoxSize) { if (box.isHorizontal()) { var scaleMargin = { left: totalLeftBoxesWidth, right: totalRightBoxesWidth, top: 0, bottom: 0 }; // Don't use min size here because of label rotation. When the labels are rotated, their rotation highly depends // on the margin. Sometimes they need to increase in size slightly box.update(box.options.fullWidth ? chartWidth : maxChartAreaWidth, chartHeight / 2, scaleMargin); } else { box.update(minBoxSize.minSize.width, maxChartAreaHeight); } } } // Figure out how much margin is on the top and bottom of the vertical boxes helpers.each(topBoxes, function(box) { totalTopBoxesHeight += box.height; }); helpers.each(bottomBoxes, function(box) { totalBottomBoxesHeight += box.height; }); // Let the left layout know the final margin helpers.each(leftBoxes.concat(rightBoxes), finalFitVerticalBox); function finalFitVerticalBox(box) { var minBoxSize = helpers.findNextWhere(minBoxSizes, function(minBoxSize) { return minBoxSize.box === box; }); var scaleMargin = { left: 0, right: 0, top: totalTopBoxesHeight, bottom: totalBottomBoxesHeight }; if (minBoxSize) { box.update(minBoxSize.minSize.width, maxChartAreaHeight, scaleMargin); } } // Recalculate because the size of each layout might have changed slightly due to the margins (label rotation for instance) totalLeftBoxesWidth = xPadding; totalRightBoxesWidth = xPadding; totalTopBoxesHeight = yPadding; totalBottomBoxesHeight = yPadding; helpers.each(leftBoxes, function(box) { totalLeftBoxesWidth += box.width; }); helpers.each(rightBoxes, function(box) { totalRightBoxesWidth += box.width; }); helpers.each(topBoxes, function(box) { totalTopBoxesHeight += box.height; }); helpers.each(bottomBoxes, function(box) { totalBottomBoxesHeight += box.height; }); // Figure out if our chart area changed. This would occur if the dataset layout label rotation // changed due to the application of the margins in step 6. Since we can only get bigger, this is safe to do // without calling `fit` again var newMaxChartAreaHeight = height - totalTopBoxesHeight - totalBottomBoxesHeight; var newMaxChartAreaWidth = width - totalLeftBoxesWidth - totalRightBoxesWidth; if (newMaxChartAreaWidth !== maxChartAreaWidth || newMaxChartAreaHeight !== maxChartAreaHeight) { helpers.each(leftBoxes, function(box) { box.height = newMaxChartAreaHeight; }); helpers.each(rightBoxes, function(box) { box.height = newMaxChartAreaHeight; }); helpers.each(topBoxes, function(box) { if (!box.options.fullWidth) { box.width = newMaxChartAreaWidth; } }); helpers.each(bottomBoxes, function(box) { if (!box.options.fullWidth) { box.width = newMaxChartAreaWidth; } }); maxChartAreaHeight = newMaxChartAreaHeight; maxChartAreaWidth = newMaxChartAreaWidth; } // Step 7 - Position the boxes var left = xPadding; var top = yPadding; var right = 0; var bottom = 0; helpers.each(leftBoxes.concat(topBoxes), placeBox); // Account for chart width and height left += maxChartAreaWidth; top += maxChartAreaHeight; helpers.each(rightBoxes, placeBox); helpers.each(bottomBoxes, placeBox); function placeBox(box) { if (box.isHorizontal()) { box.left = box.options.fullWidth ? xPadding : totalLeftBoxesWidth; box.right = box.options.fullWidth ? width - xPadding : totalLeftBoxesWidth + maxChartAreaWidth; box.top = top; box.bottom = top + box.height; // Move to next point top = box.bottom; } else { box.left = left; box.right = left + box.width; box.top = totalTopBoxesHeight; box.bottom = totalTopBoxesHeight + maxChartAreaHeight; // Move to next point left = box.right; } } // Step 8 chartInstance.chartArea = { left: totalLeftBoxesWidth, top: totalTopBoxesHeight, right: totalLeftBoxesWidth + maxChartAreaWidth, bottom: totalTopBoxesHeight + maxChartAreaHeight }; // Step 9 helpers.each(chartAreaBoxes, function(box) { box.left = chartInstance.chartArea.left; box.top = chartInstance.chartArea.top; box.right = chartInstance.chartArea.right; box.bottom = chartInstance.chartArea.bottom; box.update(maxChartAreaWidth, maxChartAreaHeight); }); } }; }; },{}],28:[function(require,module,exports){ "use strict"; module.exports = function(Chart) { var helpers = Chart.helpers; var noop = helpers.noop; Chart.defaults.global.legend = { display: true, position: 'top', fullWidth: true, // marks that this box should take the full width of the canvas (pushing down other boxes) reverse: false, // a callback that will handle onClick: function(e, legendItem) { var index = legendItem.datasetIndex; var ci = this.chart; var meta = ci.getDatasetMeta(index); // See controller.isDatasetVisible comment meta.hidden = meta.hidden === null? !ci.data.datasets[index].hidden : null; // We hid a dataset ... rerender the chart ci.update(); }, labels: { boxWidth: 40, padding: 10, // Generates labels shown in the legend // Valid properties to return: // text : text to display // fillStyle : fill of coloured box // strokeStyle: stroke of coloured box // hidden : if this legend item refers to a hidden item // lineCap : cap style for line // lineDash // lineDashOffset : // lineJoin : // lineWidth : generateLabels: function(chart) { var data = chart.data; return helpers.isArray(data.datasets) ? data.datasets.map(function(dataset, i) { return { text: dataset.label, fillStyle: dataset.backgroundColor, hidden: !chart.isDatasetVisible(i), lineCap: dataset.borderCapStyle, lineDash: dataset.borderDash, lineDashOffset: dataset.borderDashOffset, lineJoin: dataset.borderJoinStyle, lineWidth: dataset.borderWidth, strokeStyle: dataset.borderColor, // Below is extra data used for toggling the datasets datasetIndex: i }; }, this) : []; } } }; Chart.Legend = Chart.Element.extend({ initialize: function(config) { helpers.extend(this, config); // Contains hit boxes for each dataset (in dataset order) this.legendHitBoxes = []; // Are we in doughnut mode which has a different data type this.doughnutMode = false; }, // These methods are ordered by lifecyle. Utilities then follow. // Any function defined here is inherited by all legend types. // Any function can be extended by the legend type beforeUpdate: noop, update: function(maxWidth, maxHeight, margins) { // Update Lifecycle - Probably don't want to ever extend or overwrite this function ;) this.beforeUpdate(); // Absorb the master measurements this.maxWidth = maxWidth; this.maxHeight = maxHeight; this.margins = margins; // Dimensions this.beforeSetDimensions(); this.setDimensions(); this.afterSetDimensions(); // Labels this.beforeBuildLabels(); this.buildLabels(); this.afterBuildLabels(); // Fit this.beforeFit(); this.fit(); this.afterFit(); // this.afterUpdate(); return this.minSize; }, afterUpdate: noop, // beforeSetDimensions: noop, setDimensions: function() { // Set the unconstrained dimension before label rotation if (this.isHorizontal()) { // Reset position before calculating rotation this.width = this.maxWidth; this.left = 0; this.right = this.width; } else { this.height = this.maxHeight; // Reset position before calculating rotation this.top = 0; this.bottom = this.height; } // Reset padding this.paddingLeft = 0; this.paddingTop = 0; this.paddingRight = 0; this.paddingBottom = 0; // Reset minSize this.minSize = { width: 0, height: 0 }; }, afterSetDimensions: noop, // beforeBuildLabels: noop, buildLabels: function() { this.legendItems = this.options.labels.generateLabels.call(this, this.chart); if(this.options.reverse){ this.legendItems.reverse(); } }, afterBuildLabels: noop, // beforeFit: noop, fit: function() { var opts = this.options; var labelOpts = opts.labels; var display = opts.display; var ctx = this.ctx; var globalDefault = Chart.defaults.global, itemOrDefault = helpers.getValueOrDefault, fontSize = itemOrDefault(labelOpts.fontSize, globalDefault.defaultFontSize), fontStyle = itemOrDefault(labelOpts.fontStyle, globalDefault.defaultFontStyle), fontFamily = itemOrDefault(labelOpts.fontFamily, globalDefault.defaultFontFamily), labelFont = helpers.fontString(fontSize, fontStyle, fontFamily); // Reset hit boxes var hitboxes = this.legendHitBoxes = []; var minSize = this.minSize; var isHorizontal = this.isHorizontal(); if (isHorizontal) { minSize.width = this.maxWidth; // fill all the width minSize.height = display ? 10 : 0; } else { minSize.width = display ? 10 : 0; minSize.height = this.maxHeight; // fill all the height } // Increase sizes here if (display) { if (isHorizontal) { // Labels // Width of each line of legend boxes. Labels wrap onto multiple lines when there are too many to fit on one var lineWidths = this.lineWidths = [0]; var totalHeight = this.legendItems.length ? fontSize + (labelOpts.padding) : 0; ctx.textAlign = "left"; ctx.textBaseline = 'top'; ctx.font = labelFont; helpers.each(this.legendItems, function(legendItem, i) { var width = labelOpts.boxWidth + (fontSize / 2) + ctx.measureText(legendItem.text).width; if (lineWidths[lineWidths.length - 1] + width + labelOpts.padding >= this.width) { totalHeight += fontSize + (labelOpts.padding); lineWidths[lineWidths.length] = this.left; } // Store the hitbox width and height here. Final position will be updated in `draw` hitboxes[i] = { left: 0, top: 0, width: width, height: fontSize }; lineWidths[lineWidths.length - 1] += width + labelOpts.padding; }, this); minSize.height += totalHeight; } else { // TODO vertical } } this.width = minSize.width; this.height = minSize.height; }, afterFit: noop, // Shared Methods isHorizontal: function() { return this.options.position === "top" || this.options.position === "bottom"; }, // Actualy draw the legend on the canvas draw: function() { var opts = this.options; var labelOpts = opts.labels; var globalDefault = Chart.defaults.global, lineDefault = globalDefault.elements.line, legendWidth = this.width, lineWidths = this.lineWidths; if (opts.display) { var ctx = this.ctx, cursor = { x: this.left + ((legendWidth - lineWidths[0]) / 2), y: this.top + labelOpts.padding, line: 0 }, itemOrDefault = helpers.getValueOrDefault, fontColor = itemOrDefault(labelOpts.fontColor, globalDefault.defaultFontColor), fontSize = itemOrDefault(labelOpts.fontSize, globalDefault.defaultFontSize), fontStyle = itemOrDefault(labelOpts.fontStyle, globalDefault.defaultFontStyle), fontFamily = itemOrDefault(labelOpts.fontFamily, globalDefault.defaultFontFamily), labelFont = helpers.fontString(fontSize, fontStyle, fontFamily); // Horizontal if (this.isHorizontal()) { // Labels ctx.textAlign = "left"; ctx.textBaseline = 'top'; ctx.lineWidth = 0.5; ctx.strokeStyle = fontColor; // for strikethrough effect ctx.fillStyle = fontColor; // render in correct colour ctx.font = labelFont; var boxWidth = labelOpts.boxWidth, hitboxes = this.legendHitBoxes; helpers.each(this.legendItems, function(legendItem, i) { var textWidth = ctx.measureText(legendItem.text).width, width = boxWidth + (fontSize / 2) + textWidth, x = cursor.x, y = cursor.y; if (x + width >= legendWidth) { y = cursor.y += fontSize + (labelOpts.padding); cursor.line++; x = cursor.x = this.left + ((legendWidth - lineWidths[cursor.line]) / 2); } // Set the ctx for the box ctx.save(); ctx.fillStyle = itemOrDefault(legendItem.fillStyle, globalDefault.defaultColor); ctx.lineCap = itemOrDefault(legendItem.lineCap, lineDefault.borderCapStyle); ctx.lineDashOffset = itemOrDefault(legendItem.lineDashOffset, lineDefault.borderDashOffset); ctx.lineJoin = itemOrDefault(legendItem.lineJoin, lineDefault.borderJoinStyle); ctx.lineWidth = itemOrDefault(legendItem.lineWidth, lineDefault.borderWidth); ctx.strokeStyle = itemOrDefault(legendItem.strokeStyle, globalDefault.defaultColor); if (ctx.setLineDash) { // IE 9 and 10 do not support line dash ctx.setLineDash(itemOrDefault(legendItem.lineDash, lineDefault.borderDash)); } // Draw the box ctx.strokeRect(x, y, boxWidth, fontSize); ctx.fillRect(x, y, boxWidth, fontSize); ctx.restore(); hitboxes[i].left = x; hitboxes[i].top = y; // Fill the actual label ctx.fillText(legendItem.text, boxWidth + (fontSize / 2) + x, y); if (legendItem.hidden) { // Strikethrough the text if hidden ctx.beginPath(); ctx.lineWidth = 2; ctx.moveTo(boxWidth + (fontSize / 2) + x, y + (fontSize / 2)); ctx.lineTo(boxWidth + (fontSize / 2) + x + textWidth, y + (fontSize / 2)); ctx.stroke(); } cursor.x += width + (labelOpts.padding); }, this); } else { } } }, // Handle an event handleEvent: function(e) { var position = helpers.getRelativePosition(e, this.chart.chart), x = position.x, y = position.y, opts = this.options; if (x >= this.left && x <= this.right && y >= this.top && y <= this.bottom) { // See if we are touching one of the dataset boxes var lh = this.legendHitBoxes; for (var i = 0; i < lh.length; ++i) { var hitBox = lh[i]; if (x >= hitBox.left && x <= hitBox.left + hitBox.width && y >= hitBox.top && y <= hitBox.top + hitBox.height) { // Touching an element if (opts.onClick) { opts.onClick.call(this, e, this.legendItems[i]); } break; } } } } }); }; },{}],29:[function(require,module,exports){ "use strict"; module.exports = function(Chart) { var helpers = Chart.helpers; // Plugins are stored here Chart.plugins = []; Chart.pluginService = { // Register a new plugin register: function(plugin) { var p = Chart.plugins; if (p.indexOf(plugin) === -1) { p.push(plugin); } }, // Remove a registered plugin remove: function(plugin) { var p = Chart.plugins; var idx = p.indexOf(plugin); if (idx !== -1) { p.splice(idx, 1); } }, // Iterate over all plugins notifyPlugins: function(method, args, scope) { helpers.each(Chart.plugins, function(plugin) { if (plugin[method] && typeof plugin[method] === 'function') { plugin[method].apply(scope, args); } }, scope); } }; var noop = helpers.noop; Chart.PluginBase = Chart.Element.extend({ // Plugin methods. All functions are passed the chart instance // Called at start of chart init beforeInit: noop, // Called at end of chart init afterInit: noop, // Called at start of update beforeUpdate: noop, // Called at end of update afterUpdate: noop, // Called at start of draw beforeDraw: noop, // Called at end of draw afterDraw: noop, // Called during destroy destroy: noop, }); }; },{}],30:[function(require,module,exports){ "use strict"; module.exports = function(Chart) { var helpers = Chart.helpers; Chart.defaults.scale = { display: true, position: "left", // grid line settings gridLines: { display: true, color: "rgba(0, 0, 0, 0.1)", lineWidth: 1, drawOnChartArea: true, drawTicks: true, tickMarkLength: 10, zeroLineWidth: 1, zeroLineColor: "rgba(0,0,0,0.25)", offsetGridLines: false }, // scale label scaleLabel: { // actual label labelString: '', // display property display: false }, // label settings ticks: { beginAtZero: false, maxRotation: 50, mirror: false, padding: 10, reverse: false, display: true, autoSkip: true, autoSkipPadding: 0, callback: function(value) { return '' + value; } } }; Chart.Scale = Chart.Element.extend({ // These methods are ordered by lifecyle. Utilities then follow. // Any function defined here is inherited by all scale types. // Any function can be extended by the scale type beforeUpdate: function() { helpers.callCallback(this.options.beforeUpdate, [this]); }, update: function(maxWidth, maxHeight, margins) { // Update Lifecycle - Probably don't want to ever extend or overwrite this function ;) this.beforeUpdate(); // Absorb the master measurements this.maxWidth = maxWidth; this.maxHeight = maxHeight; this.margins = helpers.extend({ left: 0, right: 0, top: 0, bottom: 0 }, margins); // Dimensions this.beforeSetDimensions(); this.setDimensions(); this.afterSetDimensions(); // Data min/max this.beforeDataLimits(); this.determineDataLimits(); this.afterDataLimits(); // Ticks this.beforeBuildTicks(); this.buildTicks(); this.afterBuildTicks(); this.beforeTickToLabelConversion(); this.convertTicksToLabels(); this.afterTickToLabelConversion(); // Tick Rotation this.beforeCalculateTickRotation(); this.calculateTickRotation(); this.afterCalculateTickRotation(); // Fit this.beforeFit(); this.fit(); this.afterFit(); // this.afterUpdate(); return this.minSize; }, afterUpdate: function() { helpers.callCallback(this.options.afterUpdate, [this]); }, // beforeSetDimensions: function() { helpers.callCallback(this.options.beforeSetDimensions, [this]); }, setDimensions: function() { // Set the unconstrained dimension before label rotation if (this.isHorizontal()) { // Reset position before calculating rotation this.width = this.maxWidth; this.left = 0; this.right = this.width; } else { this.height = this.maxHeight; // Reset position before calculating rotation this.top = 0; this.bottom = this.height; } // Reset padding this.paddingLeft = 0; this.paddingTop = 0; this.paddingRight = 0; this.paddingBottom = 0; }, afterSetDimensions: function() { helpers.callCallback(this.options.afterSetDimensions, [this]); }, // Data limits beforeDataLimits: function() { helpers.callCallback(this.options.beforeDataLimits, [this]); }, determineDataLimits: helpers.noop, afterDataLimits: function() { helpers.callCallback(this.options.afterDataLimits, [this]); }, // beforeBuildTicks: function() { helpers.callCallback(this.options.beforeBuildTicks, [this]); }, buildTicks: helpers.noop, afterBuildTicks: function() { helpers.callCallback(this.options.afterBuildTicks, [this]); }, beforeTickToLabelConversion: function() { helpers.callCallback(this.options.beforeTickToLabelConversion, [this]); }, convertTicksToLabels: function() { // Convert ticks to strings this.ticks = this.ticks.map(function(numericalTick, index, ticks) { if (this.options.ticks.userCallback) { return this.options.ticks.userCallback(numericalTick, index, ticks); } return this.options.ticks.callback(numericalTick, index, ticks); }, this); }, afterTickToLabelConversion: function() { helpers.callCallback(this.options.afterTickToLabelConversion, [this]); }, // beforeCalculateTickRotation: function() { helpers.callCallback(this.options.beforeCalculateTickRotation, [this]); }, calculateTickRotation: function() { //Get the width of each grid by calculating the difference //between x offsets between 0 and 1. var tickFontSize = helpers.getValueOrDefault(this.options.ticks.fontSize, Chart.defaults.global.defaultFontSize); var tickFontStyle = helpers.getValueOrDefault(this.options.ticks.fontStyle, Chart.defaults.global.defaultFontStyle); var tickFontFamily = helpers.getValueOrDefault(this.options.ticks.fontFamily, Chart.defaults.global.defaultFontFamily); var tickLabelFont = helpers.fontString(tickFontSize, tickFontStyle, tickFontFamily); this.ctx.font = tickLabelFont; var firstWidth = this.ctx.measureText(this.ticks[0]).width; var lastWidth = this.ctx.measureText(this.ticks[this.ticks.length - 1]).width; var firstRotated; this.labelRotation = 0; this.paddingRight = 0; this.paddingLeft = 0; if (this.options.display) { if (this.isHorizontal()) { this.paddingRight = lastWidth / 2 + 3; this.paddingLeft = firstWidth / 2 + 3; if (!this.longestTextCache) { this.longestTextCache = {}; } var originalLabelWidth = helpers.longestText(this.ctx, tickLabelFont, this.ticks, this.longestTextCache); var labelWidth = originalLabelWidth; var cosRotation; var sinRotation; // Allow 3 pixels x2 padding either side for label readability // only the index matters for a dataset scale, but we want a consistent interface between scales var tickWidth = this.getPixelForTick(1) - this.getPixelForTick(0) - 6; //Max label rotation can be set or default to 90 - also act as a loop counter while (labelWidth > tickWidth && this.labelRotation < this.options.ticks.maxRotation) { cosRotation = Math.cos(helpers.toRadians(this.labelRotation)); sinRotation = Math.sin(helpers.toRadians(this.labelRotation)); firstRotated = cosRotation * firstWidth; // We're right aligning the text now. if (firstRotated + tickFontSize / 2 > this.yLabelWidth) { this.paddingLeft = firstRotated + tickFontSize / 2; } this.paddingRight = tickFontSize / 2; if (sinRotation * originalLabelWidth > this.maxHeight) { // go back one step this.labelRotation--; break; } this.labelRotation++; labelWidth = cosRotation * originalLabelWidth; } } } if (this.margins) { this.paddingLeft = Math.max(this.paddingLeft - this.margins.left, 0); this.paddingRight = Math.max(this.paddingRight - this.margins.right, 0); } }, afterCalculateTickRotation: function() { helpers.callCallback(this.options.afterCalculateTickRotation, [this]); }, // beforeFit: function() { helpers.callCallback(this.options.beforeFit, [this]); }, fit: function() { // Reset var minSize = this.minSize = { width: 0, height: 0 }; var opts = this.options; var tickOpts = opts.ticks; var scaleLabelOpts = opts.scaleLabel; var globalOpts = Chart.defaults.global; var display = opts.display; var isHorizontal = this.isHorizontal(); var tickFontSize = helpers.getValueOrDefault(tickOpts.fontSize, globalOpts.defaultFontSize); var tickFontStyle = helpers.getValueOrDefault(tickOpts.fontStyle, globalOpts.defaultFontStyle); var tickFontFamily = helpers.getValueOrDefault(tickOpts.fontFamily, globalOpts.defaultFontFamily); var tickLabelFont = helpers.fontString(tickFontSize, tickFontStyle, tickFontFamily); var scaleLabelFontSize = helpers.getValueOrDefault(scaleLabelOpts.fontSize, globalOpts.defaultFontSize); var scaleLabelFontStyle = helpers.getValueOrDefault(scaleLabelOpts.fontStyle, globalOpts.defaultFontStyle); var scaleLabelFontFamily = helpers.getValueOrDefault(scaleLabelOpts.fontFamily, globalOpts.defaultFontFamily); var scaleLabelFont = helpers.fontString(scaleLabelFontSize, scaleLabelFontStyle, scaleLabelFontFamily); var tickMarkLength = opts.gridLines.tickMarkLength; // Width if (isHorizontal) { // subtract the margins to line up with the chartArea if we are a full width scale minSize.width = this.isFullWidth() ? this.maxWidth - this.margins.left - this.margins.right : this.maxWidth; } else { minSize.width = display ? tickMarkLength : 0; } // height if (isHorizontal) { minSize.height = display ? tickMarkLength : 0; } else { minSize.height = this.maxHeight; // fill all the height } // Are we showing a title for the scale? if (scaleLabelOpts.display && display) { if (isHorizontal) { minSize.height += (scaleLabelFontSize * 1.5); } else { minSize.width += (scaleLabelFontSize * 1.5); } } if (tickOpts.display && display) { // Don't bother fitting the ticks if we are not showing them if (!this.longestTextCache) { this.longestTextCache = {}; } var largestTextWidth = helpers.longestText(this.ctx, tickLabelFont, this.ticks, this.longestTextCache); if (isHorizontal) { // A horizontal axis is more constrained by the height. this.longestLabelWidth = largestTextWidth; // TODO - improve this calculation var labelHeight = (Math.sin(helpers.toRadians(this.labelRotation)) * this.longestLabelWidth) + 1.5 * tickFontSize; minSize.height = Math.min(this.maxHeight, minSize.height + labelHeight); this.ctx.font = tickLabelFont; var firstLabelWidth = this.ctx.measureText(this.ticks[0]).width; var lastLabelWidth = this.ctx.measureText(this.ticks[this.ticks.length - 1]).width; // Ensure that our ticks are always inside the canvas. When rotated, ticks are right aligned which means that the right padding is dominated // by the font height var cosRotation = Math.cos(helpers.toRadians(this.labelRotation)); var sinRotation = Math.sin(helpers.toRadians(this.labelRotation)); this.paddingLeft = this.labelRotation !== 0 ? (cosRotation * firstLabelWidth) + 3 : firstLabelWidth / 2 + 3; // add 3 px to move away from canvas edges this.paddingRight = this.labelRotation !== 0 ? (sinRotation * (tickFontSize / 2)) + 3 : lastLabelWidth / 2 + 3; // when rotated } else { // A vertical axis is more constrained by the width. Labels are the dominant factor here, so get that length first var maxLabelWidth = this.maxWidth - minSize.width; // Account for padding var mirror = tickOpts.mirror; if (!mirror) { largestTextWidth += this.options.ticks.padding; } else { // If mirrored text is on the inside so don't expand largestTextWidth = 0; } if (largestTextWidth < maxLabelWidth) { // We don't need all the room minSize.width += largestTextWidth; } else { // Expand to max size minSize.width = this.maxWidth; } this.paddingTop = tickFontSize / 2; this.paddingBottom = tickFontSize / 2; } } if (this.margins) { this.paddingLeft = Math.max(this.paddingLeft - this.margins.left, 0); this.paddingTop = Math.max(this.paddingTop - this.margins.top, 0); this.paddingRight = Math.max(this.paddingRight - this.margins.right, 0); this.paddingBottom = Math.max(this.paddingBottom - this.margins.bottom, 0); } this.width = minSize.width; this.height = minSize.height; }, afterFit: function() { helpers.callCallback(this.options.afterFit, [this]); }, // Shared Methods isHorizontal: function() { return this.options.position === "top" || this.options.position === "bottom"; }, isFullWidth: function() { return (this.options.fullWidth); }, // Get the correct value. NaN bad inputs, If the value type is object get the x or y based on whether we are horizontal or not getRightValue: function getRightValue(rawValue) { // Null and undefined values first if (rawValue === null || typeof(rawValue) === 'undefined') { return NaN; } // isNaN(object) returns true, so make sure NaN is checking for a number if (typeof(rawValue) === 'number' && isNaN(rawValue)) { return NaN; } // If it is in fact an object, dive in one more level if (typeof(rawValue) === "object") { if (rawValue instanceof Date) { return rawValue; } else { return getRightValue(this.isHorizontal() ? rawValue.x : rawValue.y); } } // Value is good, return it return rawValue; }, // Used to get the value to display in the tooltip for the data at the given index // function getLabelForIndex(index, datasetIndex) getLabelForIndex: helpers.noop, // Used to get data value locations. Value can either be an index or a numerical value getPixelForValue: helpers.noop, // Used to get the data value from a given pixel. This is the inverse of getPixelForValue getValueForPixel: helpers.noop, // Used for tick location, should getPixelForTick: function(index, includeOffset) { if (this.isHorizontal()) { var innerWidth = this.width - (this.paddingLeft + this.paddingRight); var tickWidth = innerWidth / Math.max((this.ticks.length - ((this.options.gridLines.offsetGridLines) ? 0 : 1)), 1); var pixel = (tickWidth * index) + this.paddingLeft; if (includeOffset) { pixel += tickWidth / 2; } var finalVal = this.left + Math.round(pixel); finalVal += this.isFullWidth() ? this.margins.left : 0; return finalVal; } else { var innerHeight = this.height - (this.paddingTop + this.paddingBottom); return this.top + (index * (innerHeight / (this.ticks.length - 1))); } }, // Utility for getting the pixel location of a percentage of scale getPixelForDecimal: function(decimal /*, includeOffset*/ ) { if (this.isHorizontal()) { var innerWidth = this.width - (this.paddingLeft + this.paddingRight); var valueOffset = (innerWidth * decimal) + this.paddingLeft; var finalVal = this.left + Math.round(valueOffset); finalVal += this.isFullWidth() ? this.margins.left : 0; return finalVal; } else { return this.top + (decimal * this.height); } }, // Actualy draw the scale on the canvas // @param {rectangle} chartArea : the area of the chart to draw full grid lines on draw: function(chartArea) { if (this.options.display) { var setContextLineSettings; var isRotated = this.labelRotation !== 0; var skipRatio; var scaleLabelX; var scaleLabelY; var useAutoskipper = this.options.ticks.autoSkip; // figure out the maximum number of gridlines to show var maxTicks; if (this.options.ticks.maxTicksLimit) { maxTicks = this.options.ticks.maxTicksLimit; } var tickFontColor = helpers.getValueOrDefault(this.options.ticks.fontColor, Chart.defaults.global.defaultFontColor); var tickFontSize = helpers.getValueOrDefault(this.options.ticks.fontSize, Chart.defaults.global.defaultFontSize); var tickFontStyle = helpers.getValueOrDefault(this.options.ticks.fontStyle, Chart.defaults.global.defaultFontStyle); var tickFontFamily = helpers.getValueOrDefault(this.options.ticks.fontFamily, Chart.defaults.global.defaultFontFamily); var tickLabelFont = helpers.fontString(tickFontSize, tickFontStyle, tickFontFamily); var tl = this.options.gridLines.tickMarkLength; var scaleLabelFontColor = helpers.getValueOrDefault(this.options.scaleLabel.fontColor, Chart.defaults.global.defaultFontColor); var scaleLabelFontSize = helpers.getValueOrDefault(this.options.scaleLabel.fontSize, Chart.defaults.global.defaultFontSize); var scaleLabelFontStyle = helpers.getValueOrDefault(this.options.scaleLabel.fontStyle, Chart.defaults.global.defaultFontStyle); var scaleLabelFontFamily = helpers.getValueOrDefault(this.options.scaleLabel.fontFamily, Chart.defaults.global.defaultFontFamily); var scaleLabelFont = helpers.fontString(scaleLabelFontSize, scaleLabelFontStyle, scaleLabelFontFamily); var cosRotation = Math.cos(helpers.toRadians(this.labelRotation)); var sinRotation = Math.sin(helpers.toRadians(this.labelRotation)); var longestRotatedLabel = this.longestLabelWidth * cosRotation; var rotatedLabelHeight = tickFontSize * sinRotation; // Make sure we draw text in the correct color and font this.ctx.fillStyle = tickFontColor; if (this.isHorizontal()) { setContextLineSettings = true; var yTickStart = this.options.position === "bottom" ? this.top : this.bottom - tl; var yTickEnd = this.options.position === "bottom" ? this.top + tl : this.bottom; skipRatio = false; if (((longestRotatedLabel / 2) + this.options.ticks.autoSkipPadding) * this.ticks.length > (this.width - (this.paddingLeft + this.paddingRight))) { skipRatio = 1 + Math.floor((((longestRotatedLabel / 2) + this.options.ticks.autoSkipPadding) * this.ticks.length) / (this.width - (this.paddingLeft + this.paddingRight))); } // if they defined a max number of ticks, // increase skipRatio until that number is met if (maxTicks && this.ticks.length > maxTicks) { while (!skipRatio || this.ticks.length / (skipRatio || 1) > maxTicks) { if (!skipRatio) { skipRatio = 1; } skipRatio += 1; } } if (!useAutoskipper) { skipRatio = false; } helpers.each(this.ticks, function(label, index) { // Blank ticks var isLastTick = this.ticks.length === index + 1; // Since we always show the last tick,we need may need to hide the last shown one before var shouldSkip = (skipRatio > 1 && index % skipRatio > 0) || (index % skipRatio === 0 && index + skipRatio > this.ticks.length); if (shouldSkip && !isLastTick || (label === undefined || label === null)) { return; } var xLineValue = this.getPixelForTick(index); // xvalues for grid lines var xLabelValue = this.getPixelForTick(index, this.options.gridLines.offsetGridLines); // x values for ticks (need to consider offsetLabel option) if (this.options.gridLines.display) { if (index === (typeof this.zeroLineIndex !== 'undefined' ? this.zeroLineIndex : 0)) { // Draw the first index specially this.ctx.lineWidth = this.options.gridLines.zeroLineWidth; this.ctx.strokeStyle = this.options.gridLines.zeroLineColor; setContextLineSettings = true; // reset next time } else if (setContextLineSettings) { this.ctx.lineWidth = this.options.gridLines.lineWidth; this.ctx.strokeStyle = this.options.gridLines.color; setContextLineSettings = false; } xLineValue += helpers.aliasPixel(this.ctx.lineWidth); // Draw the label area this.ctx.beginPath(); if (this.options.gridLines.drawTicks) { this.ctx.moveTo(xLineValue, yTickStart); this.ctx.lineTo(xLineValue, yTickEnd); } // Draw the chart area if (this.options.gridLines.drawOnChartArea) { this.ctx.moveTo(xLineValue, chartArea.top); this.ctx.lineTo(xLineValue, chartArea.bottom); } // Need to stroke in the loop because we are potentially changing line widths & colours this.ctx.stroke(); } if (this.options.ticks.display) { this.ctx.save(); this.ctx.translate(xLabelValue, (isRotated) ? this.top + 12 : this.options.position === "top" ? this.bottom - tl : this.top + tl); this.ctx.rotate(helpers.toRadians(this.labelRotation) * -1); this.ctx.font = tickLabelFont; this.ctx.textAlign = (isRotated) ? "right" : "center"; this.ctx.textBaseline = (isRotated) ? "middle" : this.options.position === "top" ? "bottom" : "top"; this.ctx.fillText(label, 0, 0); this.ctx.restore(); } }, this); if (this.options.scaleLabel.display) { // Draw the scale label this.ctx.textAlign = "center"; this.ctx.textBaseline = 'middle'; this.ctx.fillStyle = scaleLabelFontColor; // render in correct colour this.ctx.font = scaleLabelFont; scaleLabelX = this.left + ((this.right - this.left) / 2); // midpoint of the width scaleLabelY = this.options.position === 'bottom' ? this.bottom - (scaleLabelFontSize / 2) : this.top + (scaleLabelFontSize / 2); this.ctx.fillText(this.options.scaleLabel.labelString, scaleLabelX, scaleLabelY); } } else { setContextLineSettings = true; var xTickStart = this.options.position === "right" ? this.left : this.right - 5; var xTickEnd = this.options.position === "right" ? this.left + 5 : this.right; helpers.each(this.ticks, function(label, index) { // If the callback returned a null or undefined value, do not draw this line if (label === undefined || label === null) { return; } var yLineValue = this.getPixelForTick(index); // xvalues for grid lines if (this.options.gridLines.display) { if (index === (typeof this.zeroLineIndex !== 'undefined' ? this.zeroLineIndex : 0)) { // Draw the first index specially this.ctx.lineWidth = this.options.gridLines.zeroLineWidth; this.ctx.strokeStyle = this.options.gridLines.zeroLineColor; setContextLineSettings = true; // reset next time } else if (setContextLineSettings) { this.ctx.lineWidth = this.options.gridLines.lineWidth; this.ctx.strokeStyle = this.options.gridLines.color; setContextLineSettings = false; } yLineValue += helpers.aliasPixel(this.ctx.lineWidth); // Draw the label area this.ctx.beginPath(); if (this.options.gridLines.drawTicks) { this.ctx.moveTo(xTickStart, yLineValue); this.ctx.lineTo(xTickEnd, yLineValue); } // Draw the chart area if (this.options.gridLines.drawOnChartArea) { this.ctx.moveTo(chartArea.left, yLineValue); this.ctx.lineTo(chartArea.right, yLineValue); } // Need to stroke in the loop because we are potentially changing line widths & colours this.ctx.stroke(); } if (this.options.ticks.display) { var xLabelValue; var yLabelValue = this.getPixelForTick(index, this.options.gridLines.offsetGridLines); // x values for ticks (need to consider offsetLabel option) this.ctx.save(); if (this.options.position === "left") { if (this.options.ticks.mirror) { xLabelValue = this.right + this.options.ticks.padding; this.ctx.textAlign = "left"; } else { xLabelValue = this.right - this.options.ticks.padding; this.ctx.textAlign = "right"; } } else { // right side if (this.options.ticks.mirror) { xLabelValue = this.left - this.options.ticks.padding; this.ctx.textAlign = "right"; } else { xLabelValue = this.left + this.options.ticks.padding; this.ctx.textAlign = "left"; } } this.ctx.translate(xLabelValue, yLabelValue); this.ctx.rotate(helpers.toRadians(this.labelRotation) * -1); this.ctx.font = tickLabelFont; this.ctx.textBaseline = "middle"; this.ctx.fillText(label, 0, 0); this.ctx.restore(); } }, this); if (this.options.scaleLabel.display) { // Draw the scale label scaleLabelX = this.options.position === 'left' ? this.left + (scaleLabelFontSize / 2) : this.right - (scaleLabelFontSize / 2); scaleLabelY = this.top + ((this.bottom - this.top) / 2); var rotation = this.options.position === 'left' ? -0.5 * Math.PI : 0.5 * Math.PI; this.ctx.save(); this.ctx.translate(scaleLabelX, scaleLabelY); this.ctx.rotate(rotation); this.ctx.textAlign = "center"; this.ctx.fillStyle =scaleLabelFontColor; // render in correct colour this.ctx.font = scaleLabelFont; this.ctx.textBaseline = 'middle'; this.ctx.fillText(this.options.scaleLabel.labelString, 0, 0); this.ctx.restore(); } } // Draw the line at the edge of the axis this.ctx.lineWidth = this.options.gridLines.lineWidth; this.ctx.strokeStyle = this.options.gridLines.color; var x1 = this.left, x2 = this.right, y1 = this.top, y2 = this.bottom; if (this.isHorizontal()) { y1 = y2 = this.options.position === 'top' ? this.bottom : this.top; y1 += helpers.aliasPixel(this.ctx.lineWidth); y2 += helpers.aliasPixel(this.ctx.lineWidth); } else { x1 = x2 = this.options.position === 'left' ? this.right : this.left; x1 += helpers.aliasPixel(this.ctx.lineWidth); x2 += helpers.aliasPixel(this.ctx.lineWidth); } this.ctx.beginPath(); this.ctx.moveTo(x1, y1); this.ctx.lineTo(x2, y2); this.ctx.stroke(); } } }); }; },{}],31:[function(require,module,exports){ "use strict"; module.exports = function(Chart) { var helpers = Chart.helpers; Chart.scaleService = { // Scale registration object. Extensions can register new scale types (such as log or DB scales) and then // use the new chart options to grab the correct scale constructors: {}, // Use a registration function so that we can move to an ES6 map when we no longer need to support // old browsers // Scale config defaults defaults: {}, registerScaleType: function(type, scaleConstructor, defaults) { this.constructors[type] = scaleConstructor; this.defaults[type] = helpers.clone(defaults); }, getScaleConstructor: function(type) { return this.constructors.hasOwnProperty(type) ? this.constructors[type] : undefined; }, getScaleDefaults: function(type) { // Return the scale defaults merged with the global settings so that we always use the latest ones return this.defaults.hasOwnProperty(type) ? helpers.scaleMerge(Chart.defaults.scale, this.defaults[type]) : {}; }, updateScaleDefaults: function(type, additions) { var defaults = this.defaults; if (defaults.hasOwnProperty(type)) { defaults[type] = helpers.extend(defaults[type], additions); } }, addScalesToLayout: function(chartInstance) { // Adds each scale to the chart.boxes array to be sized accordingly helpers.each(chartInstance.scales, function(scale) { Chart.layoutService.addBox(chartInstance, scale); }); } }; }; },{}],32:[function(require,module,exports){ "use strict"; module.exports = function(Chart) { var helpers = Chart.helpers; Chart.defaults.global.title = { display: false, position: 'top', fullWidth: true, // marks that this box should take the full width of the canvas (pushing down other boxes) fontStyle: 'bold', padding: 10, // actual title text: '' }; var noop = helpers.noop; Chart.Title = Chart.Element.extend({ initialize: function(config) { helpers.extend(this, config); this.options = helpers.configMerge(Chart.defaults.global.title, config.options); // Contains hit boxes for each dataset (in dataset order) this.legendHitBoxes = []; }, // These methods are ordered by lifecyle. Utilities then follow. beforeUpdate: noop, update: function(maxWidth, maxHeight, margins) { // Update Lifecycle - Probably don't want to ever extend or overwrite this function ;) this.beforeUpdate(); // Absorb the master measurements this.maxWidth = maxWidth; this.maxHeight = maxHeight; this.margins = margins; // Dimensions this.beforeSetDimensions(); this.setDimensions(); this.afterSetDimensions(); // Labels this.beforeBuildLabels(); this.buildLabels(); this.afterBuildLabels(); // Fit this.beforeFit(); this.fit(); this.afterFit(); // this.afterUpdate(); return this.minSize; }, afterUpdate: noop, // beforeSetDimensions: noop, setDimensions: function() { // Set the unconstrained dimension before label rotation if (this.isHorizontal()) { // Reset position before calculating rotation this.width = this.maxWidth; this.left = 0; this.right = this.width; } else { this.height = this.maxHeight; // Reset position before calculating rotation this.top = 0; this.bottom = this.height; } // Reset padding this.paddingLeft = 0; this.paddingTop = 0; this.paddingRight = 0; this.paddingBottom = 0; // Reset minSize this.minSize = { width: 0, height: 0 }; }, afterSetDimensions: noop, // beforeBuildLabels: noop, buildLabels: noop, afterBuildLabels: noop, // beforeFit: noop, fit: function() { var ctx = this.ctx, valueOrDefault = helpers.getValueOrDefault, opts = this.options, globalDefaults = Chart.defaults.global, display = opts.display, fontSize = valueOrDefault(opts.fontSize, globalDefaults.defaultFontSize), minSize = this.minSize; if (this.isHorizontal()) { minSize.width = this.maxWidth; // fill all the width minSize.height = display ? fontSize + (opts.padding * 2) : 0; } else { minSize.width = display ? fontSize + (opts.padding * 2) : 0; minSize.height = this.maxHeight; // fill all the height } this.width = minSize.width; this.height = minSize.height; }, afterFit: noop, // Shared Methods isHorizontal: function() { var pos = this.options.position; return pos === "top" || pos === "bottom"; }, // Actualy draw the title block on the canvas draw: function() { var ctx = this.ctx, valueOrDefault = helpers.getValueOrDefault, opts = this.options, globalDefaults = Chart.defaults.global; if (opts.display) { var fontSize = valueOrDefault(opts.fontSize, globalDefaults.defaultFontSize), fontStyle = valueOrDefault(opts.fontStyle, globalDefaults.defaultFontStyle), fontFamily = valueOrDefault(opts.fontFamily, globalDefaults.defaultFontFamily), titleFont = helpers.fontString(fontSize, fontStyle, fontFamily), rotation = 0, titleX, titleY; ctx.fillStyle = valueOrDefault(opts.fontColor, globalDefaults.defaultFontColor); // render in correct colour ctx.font = titleFont; // Horizontal if (this.isHorizontal()) { titleX = this.left + ((this.right - this.left) / 2); // midpoint of the width titleY = this.top + ((this.bottom - this.top) / 2); // midpoint of the height } else { titleX = opts.position === 'left' ? this.left + (fontSize / 2) : this.right - (fontSize / 2); titleY = this.top + ((this.bottom - this.top) / 2); rotation = Math.PI * (opts.position === 'left' ? -0.5 : 0.5); } ctx.save(); ctx.translate(titleX, titleY); ctx.rotate(rotation); ctx.textAlign = 'center'; ctx.textBaseline = 'middle'; ctx.fillText(opts.text, 0, 0); ctx.restore(); } } }); }; },{}],33:[function(require,module,exports){ "use strict"; module.exports = function(Chart) { var helpers = Chart.helpers; Chart.defaults.global.tooltips = { enabled: true, custom: null, mode: 'single', backgroundColor: "rgba(0,0,0,0.8)", titleFontStyle: "bold", titleSpacing: 2, titleMarginBottom: 6, titleColor: "#fff", titleAlign: "left", bodySpacing: 2, bodyColor: "#fff", bodyAlign: "left", footerFontStyle: "bold", footerSpacing: 2, footerMarginTop: 6, footerColor: "#fff", footerAlign: "left", yPadding: 6, xPadding: 6, yAlign : 'center', xAlign : 'center', caretSize: 5, cornerRadius: 6, multiKeyBackground: '#fff', callbacks: { // Args are: (tooltipItems, data) beforeTitle: helpers.noop, title: function(tooltipItems, data) { // Pick first xLabel for now var title = ''; if (tooltipItems.length > 0) { if (tooltipItems[0].xLabel) { title = tooltipItems[0].xLabel; } else if (data.labels.length > 0 && tooltipItems[0].index < data.labels.length) { title = data.labels[tooltipItems[0].index]; } } return title; }, afterTitle: helpers.noop, // Args are: (tooltipItems, data) beforeBody: helpers.noop, // Args are: (tooltipItem, data) beforeLabel: helpers.noop, label: function(tooltipItem, data) { var datasetLabel = data.datasets[tooltipItem.datasetIndex].label || ''; return datasetLabel + ': ' + tooltipItem.yLabel; }, afterLabel: helpers.noop, // Args are: (tooltipItems, data) afterBody: helpers.noop, // Args are: (tooltipItems, data) beforeFooter: helpers.noop, footer: helpers.noop, afterFooter: helpers.noop } }; // Helper to push or concat based on if the 2nd parameter is an array or not function pushOrConcat(base, toPush) { if (toPush) { if (helpers.isArray(toPush)) { base = base.concat(toPush); } else { base.push(toPush); } } return base; } Chart.Tooltip = Chart.Element.extend({ initialize: function() { var options = this._options; helpers.extend(this, { _model: { // Positioning xPadding: options.tooltips.xPadding, yPadding: options.tooltips.yPadding, xAlign : options.tooltips.yAlign, yAlign : options.tooltips.xAlign, // Body bodyColor: options.tooltips.bodyColor, _bodyFontFamily: helpers.getValueOrDefault(options.tooltips.bodyFontFamily, Chart.defaults.global.defaultFontFamily), _bodyFontStyle: helpers.getValueOrDefault(options.tooltips.bodyFontStyle, Chart.defaults.global.defaultFontStyle), _bodyAlign: options.tooltips.bodyAlign, bodyFontSize: helpers.getValueOrDefault(options.tooltips.bodyFontSize, Chart.defaults.global.defaultFontSize), bodySpacing: options.tooltips.bodySpacing, // Title titleColor: options.tooltips.titleColor, _titleFontFamily: helpers.getValueOrDefault(options.tooltips.titleFontFamily, Chart.defaults.global.defaultFontFamily), _titleFontStyle: helpers.getValueOrDefault(options.tooltips.titleFontStyle, Chart.defaults.global.defaultFontStyle), titleFontSize: helpers.getValueOrDefault(options.tooltips.titleFontSize, Chart.defaults.global.defaultFontSize), _titleAlign: options.tooltips.titleAlign, titleSpacing: options.tooltips.titleSpacing, titleMarginBottom: options.tooltips.titleMarginBottom, // Footer footerColor: options.tooltips.footerColor, _footerFontFamily: helpers.getValueOrDefault(options.tooltips.footerFontFamily, Chart.defaults.global.defaultFontFamily), _footerFontStyle: helpers.getValueOrDefault(options.tooltips.footerFontStyle, Chart.defaults.global.defaultFontStyle), footerFontSize: helpers.getValueOrDefault(options.tooltips.footerFontSize, Chart.defaults.global.defaultFontSize), _footerAlign: options.tooltips.footerAlign, footerSpacing: options.tooltips.footerSpacing, footerMarginTop: options.tooltips.footerMarginTop, // Appearance caretSize: options.tooltips.caretSize, cornerRadius: options.tooltips.cornerRadius, backgroundColor: options.tooltips.backgroundColor, opacity: 0, legendColorBackground: options.tooltips.multiKeyBackground } }); }, // Get the title // Args are: (tooltipItem, data) getTitle: function() { var beforeTitle = this._options.tooltips.callbacks.beforeTitle.apply(this, arguments), title = this._options.tooltips.callbacks.title.apply(this, arguments), afterTitle = this._options.tooltips.callbacks.afterTitle.apply(this, arguments); var lines = []; lines = pushOrConcat(lines, beforeTitle); lines = pushOrConcat(lines, title); lines = pushOrConcat(lines, afterTitle); return lines; }, // Args are: (tooltipItem, data) getBeforeBody: function() { var lines = this._options.tooltips.callbacks.beforeBody.apply(this, arguments); return helpers.isArray(lines) ? lines : lines !== undefined ? [lines] : []; }, // Args are: (tooltipItem, data) getBody: function(tooltipItems, data) { var lines = []; helpers.each(tooltipItems, function(bodyItem) { helpers.pushAllIfDefined(this._options.tooltips.callbacks.beforeLabel.call(this, bodyItem, data), lines); helpers.pushAllIfDefined(this._options.tooltips.callbacks.label.call(this, bodyItem, data), lines); helpers.pushAllIfDefined(this._options.tooltips.callbacks.afterLabel.call(this, bodyItem, data), lines); }, this); return lines; }, // Args are: (tooltipItem, data) getAfterBody: function() { var lines = this._options.tooltips.callbacks.afterBody.apply(this, arguments); return helpers.isArray(lines) ? lines : lines !== undefined ? [lines] : []; }, // Get the footer and beforeFooter and afterFooter lines // Args are: (tooltipItem, data) getFooter: function() { var beforeFooter = this._options.tooltips.callbacks.beforeFooter.apply(this, arguments); var footer = this._options.tooltips.callbacks.footer.apply(this, arguments); var afterFooter = this._options.tooltips.callbacks.afterFooter.apply(this, arguments); var lines = []; lines = pushOrConcat(lines, beforeFooter); lines = pushOrConcat(lines, footer); lines = pushOrConcat(lines, afterFooter); return lines; }, getAveragePosition: function(elements) { if (!elements.length) { return false; } var xPositions = []; var yPositions = []; helpers.each(elements, function(el) { if (el) { var pos = el.tooltipPosition(); xPositions.push(pos.x); yPositions.push(pos.y); } }); var x = 0, y = 0; for (var i = 0; i < xPositions.length; i++) { x += xPositions[i]; y += yPositions[i]; } return { x: Math.round(x / xPositions.length), y: Math.round(y / xPositions.length) }; }, update: function(changed) { if (this._active.length) { this._model.opacity = 1; var element = this._active[0], labelColors = [], tooltipPosition; var tooltipItems = []; if (this._options.tooltips.mode === 'single') { var yScale = element._yScale || element._scale; // handle radar || polarArea charts tooltipItems.push({ xLabel: element._xScale ? element._xScale.getLabelForIndex(element._index, element._datasetIndex) : '', yLabel: yScale ? yScale.getLabelForIndex(element._index, element._datasetIndex) : '', index: element._index, datasetIndex: element._datasetIndex }); tooltipPosition = this.getAveragePosition(this._active); } else { helpers.each(this._data.datasets, function(dataset, datasetIndex) { if (!this._chartInstance.isDatasetVisible(datasetIndex)) { return; } var meta = this._chartInstance.getDatasetMeta(datasetIndex); var currentElement = meta.data[element._index]; if (currentElement) { var yScale = element._yScale || element._scale; // handle radar || polarArea charts tooltipItems.push({ xLabel: currentElement._xScale ? currentElement._xScale.getLabelForIndex(currentElement._index, currentElement._datasetIndex) : '', yLabel: yScale ? yScale.getLabelForIndex(currentElement._index, currentElement._datasetIndex) : '', index: element._index, datasetIndex: datasetIndex }); } }, this); helpers.each(this._active, function(active) { if (active) { labelColors.push({ borderColor: active._view.borderColor, backgroundColor: active._view.backgroundColor }); } }, null); tooltipPosition = this.getAveragePosition(this._active); } // Build the Text Lines helpers.extend(this._model, { title: this.getTitle(tooltipItems, this._data), beforeBody: this.getBeforeBody(tooltipItems, this._data), body: this.getBody(tooltipItems, this._data), afterBody: this.getAfterBody(tooltipItems, this._data), footer: this.getFooter(tooltipItems, this._data) }); helpers.extend(this._model, { x: Math.round(tooltipPosition.x), y: Math.round(tooltipPosition.y), caretPadding: helpers.getValueOrDefault(tooltipPosition.padding, 2), labelColors: labelColors }); // We need to determine alignment of var tooltipSize = this.getTooltipSize(this._model); this.determineAlignment(tooltipSize); // Smart Tooltip placement to stay on the canvas helpers.extend(this._model, this.getBackgroundPoint(this._model, tooltipSize)); } else { this._model.opacity = 0; } if (changed && this._options.tooltips.custom) { this._options.tooltips.custom.call(this, this._model); } return this; }, getTooltipSize: function getTooltipSize(vm) { var ctx = this._chart.ctx; var size = { height: vm.yPadding * 2, // Tooltip Padding width: 0 }; var combinedBodyLength = vm.body.length + vm.beforeBody.length + vm.afterBody.length; size.height += vm.title.length * vm.titleFontSize; // Title Lines size.height += (vm.title.length - 1) * vm.titleSpacing; // Title Line Spacing size.height += vm.title.length ? vm.titleMarginBottom : 0; // Title's bottom Margin size.height += combinedBodyLength * vm.bodyFontSize; // Body Lines size.height += combinedBodyLength ? (combinedBodyLength - 1) * vm.bodySpacing : 0; // Body Line Spacing size.height += vm.footer.length ? vm.footerMarginTop : 0; // Footer Margin size.height += vm.footer.length * (vm.footerFontSize); // Footer Lines size.height += vm.footer.length ? (vm.footer.length - 1) * vm.footerSpacing : 0; // Footer Line Spacing // Width ctx.font = helpers.fontString(vm.titleFontSize, vm._titleFontStyle, vm._titleFontFamily); helpers.each(vm.title, function(line) { size.width = Math.max(size.width, ctx.measureText(line).width); }); ctx.font = helpers.fontString(vm.bodyFontSize, vm._bodyFontStyle, vm._bodyFontFamily); helpers.each(vm.beforeBody.concat(vm.afterBody), function(line) { size.width = Math.max(size.width, ctx.measureText(line).width); }); helpers.each(vm.body, function(line) { size.width = Math.max(size.width, ctx.measureText(line).width + (this._options.tooltips.mode !== 'single' ? (vm.bodyFontSize + 2) : 0)); }, this); ctx.font = helpers.fontString(vm.footerFontSize, vm._footerFontStyle, vm._footerFontFamily); helpers.each(vm.footer, function(line) { size.width = Math.max(size.width, ctx.measureText(line).width); }); size.width += 2 * vm.xPadding; return size; }, determineAlignment: function determineAlignment(size) { if (this._model.y < size.height) { this._model.yAlign = 'top'; } else if (this._model.y > (this._chart.height - size.height)) { this._model.yAlign = 'bottom'; } var lf, rf; // functions to determine left, right alignment var olf, orf; // functions to determine if left/right alignment causes tooltip to go outside chart var yf; // function to get the y alignment if the tooltip goes outside of the left or right edges var _this = this; var midX = (this._chartInstance.chartArea.left + this._chartInstance.chartArea.right) / 2; var midY = (this._chartInstance.chartArea.top + this._chartInstance.chartArea.bottom) / 2; if (this._model.yAlign === 'center') { lf = function(x) { return x <= midX; }; rf = function(x) { return x > midX; }; } else { lf = function(x) { return x <= (size.width / 2); }; rf = function(x) { return x >= (_this._chart.width - (size.width / 2)); }; } olf = function(x) { return x + size.width > _this._chart.width; }; orf = function(x) { return x - size.width < 0; }; yf = function(y) { return y <= midY ? 'top' : 'bottom'; }; if (lf(this._model.x)) { this._model.xAlign = 'left'; // Is tooltip too wide and goes over the right side of the chart.? if (olf(this._model.x)) { this._model.xAlign = 'center'; this._model.yAlign = yf(this._model.y); } } else if (rf(this._model.x)) { this._model.xAlign = 'right'; // Is tooltip too wide and goes outside left edge of canvas? if (orf(this._model.x)) { this._model.xAlign = 'center'; this._model.yAlign = yf(this._model.y); } } }, getBackgroundPoint: function getBackgroundPoint(vm, size) { // Background Position var pt = { x: vm.x, y: vm.y }; if (vm.xAlign === 'right') { pt.x -= size.width; } else if (vm.xAlign === 'center') { pt.x -= (size.width / 2); } if (vm.yAlign === 'top') { pt.y += vm.caretPadding + vm.caretSize; } else if (vm.yAlign === 'bottom') { pt.y -= size.height + vm.caretPadding + vm.caretSize; } else { pt.y -= (size.height / 2); } if (vm.yAlign === 'center') { if (vm.xAlign === 'left') { pt.x += vm.caretPadding + vm.caretSize; } else if (vm.xAlign === 'right') { pt.x -= vm.caretPadding + vm.caretSize; } } else { if (vm.xAlign === 'left') { pt.x -= vm.cornerRadius + vm.caretPadding; } else if (vm.xAlign === 'right') { pt.x += vm.cornerRadius + vm.caretPadding; } } return pt; }, drawCaret: function drawCaret(tooltipPoint, size, opacity, caretPadding) { var vm = this._view; var ctx = this._chart.ctx; var x1, x2, x3; var y1, y2, y3; if (vm.yAlign === 'center') { // Left or right side if (vm.xAlign === 'left') { x1 = tooltipPoint.x; x2 = x1 - vm.caretSize; x3 = x1; } else { x1 = tooltipPoint.x + size.width; x2 = x1 + vm.caretSize; x3 = x1; } y2 = tooltipPoint.y + (size.height / 2); y1 = y2 - vm.caretSize; y3 = y2 + vm.caretSize; } else { if (vm.xAlign === 'left') { x1 = tooltipPoint.x + vm.cornerRadius; x2 = x1 + vm.caretSize; x3 = x2 + vm.caretSize; } else if (vm.xAlign === 'right') { x1 = tooltipPoint.x + size.width - vm.cornerRadius; x2 = x1 - vm.caretSize; x3 = x2 - vm.caretSize; } else { x2 = tooltipPoint.x + (size.width / 2); x1 = x2 - vm.caretSize; x3 = x2 + vm.caretSize; } if (vm.yAlign === 'top') { y1 = tooltipPoint.y; y2 = y1 - vm.caretSize; y3 = y1; } else { y1 = tooltipPoint.y + size.height; y2 = y1 + vm.caretSize; y3 = y1; } } var bgColor = helpers.color(vm.backgroundColor); ctx.fillStyle = bgColor.alpha(opacity * bgColor.alpha()).rgbString(); ctx.beginPath(); ctx.moveTo(x1, y1); ctx.lineTo(x2, y2); ctx.lineTo(x3, y3); ctx.closePath(); ctx.fill(); }, drawTitle: function drawTitle(pt, vm, ctx, opacity) { if (vm.title.length) { ctx.textAlign = vm._titleAlign; ctx.textBaseline = "top"; var titleColor = helpers.color(vm.titleColor); ctx.fillStyle = titleColor.alpha(opacity * titleColor.alpha()).rgbString(); ctx.font = helpers.fontString(vm.titleFontSize, vm._titleFontStyle, vm._titleFontFamily); helpers.each(vm.title, function(title, i) { ctx.fillText(title, pt.x, pt.y); pt.y += vm.titleFontSize + vm.titleSpacing; // Line Height and spacing if (i + 1 === vm.title.length) { pt.y += vm.titleMarginBottom - vm.titleSpacing; // If Last, add margin, remove spacing } }); } }, drawBody: function drawBody(pt, vm, ctx, opacity) { ctx.textAlign = vm._bodyAlign; ctx.textBaseline = "top"; var bodyColor = helpers.color(vm.bodyColor); ctx.fillStyle = bodyColor.alpha(opacity * bodyColor.alpha()).rgbString(); ctx.font = helpers.fontString(vm.bodyFontSize, vm._bodyFontStyle, vm._bodyFontFamily); // Before Body helpers.each(vm.beforeBody, function(beforeBody) { ctx.fillText(beforeBody, pt.x, pt.y); pt.y += vm.bodyFontSize + vm.bodySpacing; }); helpers.each(vm.body, function(body, i) { // Draw Legend-like boxes if needed if (this._options.tooltips.mode !== 'single') { // Fill a white rect so that colours merge nicely if the opacity is < 1 ctx.fillStyle = helpers.color(vm.legendColorBackground).alpha(opacity).rgbaString(); ctx.fillRect(pt.x, pt.y, vm.bodyFontSize, vm.bodyFontSize); // Border ctx.strokeStyle = helpers.color(vm.labelColors[i].borderColor).alpha(opacity).rgbaString(); ctx.strokeRect(pt.x, pt.y, vm.bodyFontSize, vm.bodyFontSize); // Inner square ctx.fillStyle = helpers.color(vm.labelColors[i].backgroundColor).alpha(opacity).rgbaString(); ctx.fillRect(pt.x + 1, pt.y + 1, vm.bodyFontSize - 2, vm.bodyFontSize - 2); ctx.fillStyle = helpers.color(vm.bodyColor).alpha(opacity).rgbaString(); // Return fill style for text } // Body Line ctx.fillText(body, pt.x + (this._options.tooltips.mode !== 'single' ? (vm.bodyFontSize + 2) : 0), pt.y); pt.y += vm.bodyFontSize + vm.bodySpacing; }, this); // After Body helpers.each(vm.afterBody, function(afterBody) { ctx.fillText(afterBody, pt.x, pt.y); pt.y += vm.bodyFontSize; }); pt.y -= vm.bodySpacing; // Remove last body spacing }, drawFooter: function drawFooter(pt, vm, ctx, opacity) { if (vm.footer.length) { pt.y += vm.footerMarginTop; ctx.textAlign = vm._footerAlign; ctx.textBaseline = "top"; var footerColor = helpers.color(vm.footerColor); ctx.fillStyle = footerColor.alpha(opacity * footerColor.alpha()).rgbString(); ctx.font = helpers.fontString(vm.footerFontSize, vm._footerFontStyle, vm._footerFontFamily); helpers.each(vm.footer, function(footer) { ctx.fillText(footer, pt.x, pt.y); pt.y += vm.footerFontSize + vm.footerSpacing; }); } }, draw: function draw() { var ctx = this._chart.ctx; var vm = this._view; if (vm.opacity === 0) { return; } var caretPadding = vm.caretPadding; var tooltipSize = this.getTooltipSize(vm); var pt = { x: vm.x, y: vm.y }; // IE11/Edge does not like very small opacities, so snap to 0 var opacity = Math.abs(vm.opacity < 1e-3) ? 0 : vm.opacity; if (this._options.tooltips.enabled) { // Draw Background var bgColor = helpers.color(vm.backgroundColor); ctx.fillStyle = bgColor.alpha(opacity * bgColor.alpha()).rgbString(); helpers.drawRoundedRectangle(ctx, pt.x, pt.y, tooltipSize.width, tooltipSize.height, vm.cornerRadius); ctx.fill(); // Draw Caret this.drawCaret(pt, tooltipSize, opacity, caretPadding); // Draw Title, Body, and Footer pt.x += vm.xPadding; pt.y += vm.yPadding; // Titles this.drawTitle(pt, vm, ctx, opacity); // Body this.drawBody(pt, vm, ctx, opacity); // Footer this.drawFooter(pt, vm, ctx, opacity); } } }); }; },{}],34:[function(require,module,exports){ "use strict"; module.exports = function(Chart, moment) { var helpers = Chart.helpers, globalOpts = Chart.defaults.global; globalOpts.elements.arc = { backgroundColor: globalOpts.defaultColor, borderColor: "#fff", borderWidth: 2 }; Chart.elements.Arc = Chart.Element.extend({ inLabelRange: function(mouseX) { var vm = this._view; if (vm) { return (Math.pow(mouseX - vm.x, 2) < Math.pow(vm.radius + vm.hoverRadius, 2)); } else { return false; } }, inRange: function(chartX, chartY) { var vm = this._view; if (vm) { var pointRelativePosition = helpers.getAngleFromPoint(vm, { x: chartX, y: chartY }), angle = pointRelativePosition.angle, distance = pointRelativePosition.distance; //Sanitise angle range var startAngle = vm.startAngle; var endAngle = vm.endAngle; while (endAngle < startAngle) { endAngle += 2.0 * Math.PI; } while (angle > endAngle) { angle -= 2.0 * Math.PI; } while (angle < startAngle) { angle += 2.0 * Math.PI; } //Check if within the range of the open/close angle var betweenAngles = (angle >= startAngle && angle <= endAngle), withinRadius = (distance >= vm.innerRadius && distance <= vm.outerRadius); return (betweenAngles && withinRadius); } else { return false; } }, tooltipPosition: function() { var vm = this._view; var centreAngle = vm.startAngle + ((vm.endAngle - vm.startAngle) / 2), rangeFromCentre = (vm.outerRadius - vm.innerRadius) / 2 + vm.innerRadius; return { x: vm.x + (Math.cos(centreAngle) * rangeFromCentre), y: vm.y + (Math.sin(centreAngle) * rangeFromCentre) }; }, draw: function() { var ctx = this._chart.ctx, vm = this._view, sA = vm.startAngle, eA = vm.endAngle; ctx.beginPath(); ctx.arc(vm.x, vm.y, vm.outerRadius, sA, eA); ctx.arc(vm.x, vm.y, vm.innerRadius, eA, sA, true); ctx.closePath(); ctx.strokeStyle = vm.borderColor; ctx.lineWidth = vm.borderWidth; ctx.fillStyle = vm.backgroundColor; ctx.fill(); ctx.lineJoin = 'bevel'; if (vm.borderWidth) { ctx.stroke(); } } }); }; },{}],35:[function(require,module,exports){ "use strict"; module.exports = function(Chart) { var helpers = Chart.helpers; Chart.defaults.global.elements.line = { tension: 0.4, backgroundColor: Chart.defaults.global.defaultColor, borderWidth: 3, borderColor: Chart.defaults.global.defaultColor, borderCapStyle: 'butt', borderDash: [], borderDashOffset: 0.0, borderJoinStyle: 'miter', fill: true // do we fill in the area between the line and its base axis }; Chart.elements.Line = Chart.Element.extend({ lineToNextPoint: function(previousPoint, point, nextPoint, skipHandler, previousSkipHandler) { var ctx = this._chart.ctx; if (point._view.skip) { skipHandler.call(this, previousPoint, point, nextPoint); } else if (previousPoint._view.skip) { previousSkipHandler.call(this, previousPoint, point, nextPoint); } else if (point._view.tension === 0) { ctx.lineTo(point._view.x, point._view.y); } else { // Line between points ctx.bezierCurveTo( previousPoint._view.controlPointNextX, previousPoint._view.controlPointNextY, point._view.controlPointPreviousX, point._view.controlPointPreviousY, point._view.x, point._view.y ); } }, draw: function() { var _this = this; var vm = this._view; var ctx = this._chart.ctx; var first = this._children[0]; var last = this._children[this._children.length - 1]; function loopBackToStart(drawLineToCenter) { if (!first._view.skip && !last._view.skip) { // Draw a bezier line from last to first ctx.bezierCurveTo( last._view.controlPointNextX, last._view.controlPointNextY, first._view.controlPointPreviousX, first._view.controlPointPreviousY, first._view.x, first._view.y ); } else if (drawLineToCenter) { // Go to center ctx.lineTo(_this._view.scaleZero.x, _this._view.scaleZero.y); } } ctx.save(); // If we had points and want to fill this line, do so. if (this._children.length > 0 && vm.fill) { // Draw the background first (so the border is always on top) ctx.beginPath(); helpers.each(this._children, function(point, index) { var previous = helpers.previousItem(this._children, index); var next = helpers.nextItem(this._children, index); // First point moves to it's starting position no matter what if (index === 0) { if (this._loop) { ctx.moveTo(vm.scaleZero.x, vm.scaleZero.y); } else { ctx.moveTo(point._view.x, vm.scaleZero); } if (point._view.skip) { if (!this._loop) { ctx.moveTo(next._view.x, this._view.scaleZero); } } else { ctx.lineTo(point._view.x, point._view.y); } } else { this.lineToNextPoint(previous, point, next, function(previousPoint, point, nextPoint) { if (this._loop) { // Go to center ctx.lineTo(this._view.scaleZero.x, this._view.scaleZero.y); } else { ctx.lineTo(previousPoint._view.x, this._view.scaleZero); ctx.moveTo(nextPoint._view.x, this._view.scaleZero); } }, function(previousPoint, point) { // If we skipped the last point, draw a line to ourselves so that the fill is nice ctx.lineTo(point._view.x, point._view.y); }); } }, this); // For radial scales, loop back around to the first point if (this._loop) { loopBackToStart(true); } else { //Round off the line by going to the base of the chart, back to the start, then fill. ctx.lineTo(this._children[this._children.length - 1]._view.x, vm.scaleZero); ctx.lineTo(this._children[0]._view.x, vm.scaleZero); } ctx.fillStyle = vm.backgroundColor || Chart.defaults.global.defaultColor; ctx.closePath(); ctx.fill(); } // Now draw the line between all the points with any borders ctx.lineCap = vm.borderCapStyle || Chart.defaults.global.elements.line.borderCapStyle; // IE 9 and 10 do not support line dash if (ctx.setLineDash) { ctx.setLineDash(vm.borderDash || Chart.defaults.global.elements.line.borderDash); } ctx.lineDashOffset = vm.borderDashOffset || Chart.defaults.global.elements.line.borderDashOffset; ctx.lineJoin = vm.borderJoinStyle || Chart.defaults.global.elements.line.borderJoinStyle; ctx.lineWidth = vm.borderWidth || Chart.defaults.global.elements.line.borderWidth; ctx.strokeStyle = vm.borderColor || Chart.defaults.global.defaultColor; ctx.beginPath(); helpers.each(this._children, function(point, index) { var previous = helpers.previousItem(this._children, index); var next = helpers.nextItem(this._children, index); if (index === 0) { ctx.moveTo(point._view.x, point._view.y); } else { this.lineToNextPoint(previous, point, next, function(previousPoint, point, nextPoint) { ctx.moveTo(nextPoint._view.x, nextPoint._view.y); }, function(previousPoint, point) { // If we skipped the last point, move up to our point preventing a line from being drawn ctx.moveTo(point._view.x, point._view.y); }); } }, this); if (this._loop && this._children.length > 0) { loopBackToStart(); } ctx.stroke(); ctx.restore(); } }); }; },{}],36:[function(require,module,exports){ "use strict"; module.exports = function(Chart) { var helpers = Chart.helpers, globalOpts = Chart.defaults.global; globalOpts.elements.point = { radius: 3, pointStyle: 'circle', backgroundColor: globalOpts.defaultColor, borderWidth: 1, borderColor: globalOpts.defaultColor, // Hover hitRadius: 1, hoverRadius: 4, hoverBorderWidth: 1 }; Chart.elements.Point = Chart.Element.extend({ inRange: function(mouseX, mouseY) { var vm = this._view; return vm ? ((Math.pow(mouseX - vm.x, 2) + Math.pow(mouseY - vm.y, 2)) < Math.pow(vm.hitRadius + vm.radius, 2)) : false; }, inLabelRange: function(mouseX) { var vm = this._view; return vm ? (Math.pow(mouseX - vm.x, 2) < Math.pow(vm.radius + vm.hitRadius, 2)) : false; }, tooltipPosition: function() { var vm = this._view; return { x: vm.x, y: vm.y, padding: vm.radius + vm.borderWidth }; }, draw: function() { var vm = this._view, x = vm.x, y = vm.y; var ctx = this._chart.ctx; if (vm.skip) { return; } var pointStyle = vm.pointStyle; if (typeof pointStyle === 'object' && ((pointStyle.toString() === '[object HTMLImageElement]') || (pointStyle.toString() === '[object HTMLCanvasElement]'))) { ctx.drawImage(pointStyle, x - pointStyle.width / 2, y - pointStyle.height / 2); return; } if (!isNaN(vm.radius) && vm.radius > 0) { ctx.strokeStyle = vm.borderColor || Chart.defaults.global.defaultColor; ctx.lineWidth = helpers.getValueOrDefault(vm.borderWidth, Chart.defaults.global.elements.point.borderWidth); ctx.fillStyle = vm.backgroundColor || Chart.defaults.global.defaultColor; var radius = vm.radius; var xOffset, yOffset; switch (pointStyle) { // Default includes circle default: ctx.beginPath(); ctx.arc(x, y, radius, 0, Math.PI * 2); ctx.closePath(); ctx.fill(); break; case 'triangle': ctx.beginPath(); var edgeLength = 3 * radius / Math.sqrt(3); var height = edgeLength * Math.sqrt(3) / 2; ctx.moveTo(x - edgeLength / 2, y + height / 3); ctx.lineTo(x + edgeLength / 2, y + height / 3); ctx.lineTo(x, y - 2 * height / 3); ctx.closePath(); ctx.fill(); break; case 'rect': ctx.fillRect(x - 1 / Math.SQRT2 * radius, y - 1 / Math.SQRT2 * radius, 2 / Math.SQRT2 * radius, 2 / Math.SQRT2 * radius); ctx.strokeRect(x - 1 / Math.SQRT2 * radius, y - 1 / Math.SQRT2 * radius, 2 / Math.SQRT2 * radius, 2 / Math.SQRT2 * radius); break; case 'rectRot': ctx.translate(x, y); ctx.rotate(Math.PI / 4); ctx.fillRect(-1 / Math.SQRT2 * radius, -1 / Math.SQRT2 * radius, 2 / Math.SQRT2 * radius, 2 / Math.SQRT2 * radius); ctx.strokeRect(-1 / Math.SQRT2 * radius, -1 / Math.SQRT2 * radius, 2 / Math.SQRT2 * radius, 2 / Math.SQRT2 * radius); ctx.setTransform(1, 0, 0, 1, 0, 0); break; case 'cross': ctx.beginPath(); ctx.moveTo(x, y + radius); ctx.lineTo(x, y - radius); ctx.moveTo(x - radius, y); ctx.lineTo(x + radius, y); ctx.closePath(); break; case 'crossRot': ctx.beginPath(); xOffset = Math.cos(Math.PI / 4) * radius; yOffset = Math.sin(Math.PI / 4) * radius; ctx.moveTo(x - xOffset, y - yOffset); ctx.lineTo(x + xOffset, y + yOffset); ctx.moveTo(x - xOffset, y + yOffset); ctx.lineTo(x + xOffset, y - yOffset); ctx.closePath(); break; case 'star': ctx.beginPath(); ctx.moveTo(x, y + radius); ctx.lineTo(x, y - radius); ctx.moveTo(x - radius, y); ctx.lineTo(x + radius, y); xOffset = Math.cos(Math.PI / 4) * radius; yOffset = Math.sin(Math.PI / 4) * radius; ctx.moveTo(x - xOffset, y - yOffset); ctx.lineTo(x + xOffset, y + yOffset); ctx.moveTo(x - xOffset, y + yOffset); ctx.lineTo(x + xOffset, y - yOffset); ctx.closePath(); break; case 'line': ctx.beginPath(); ctx.moveTo(x - radius, y); ctx.lineTo(x + radius, y); ctx.closePath(); break; case 'dash': ctx.beginPath(); ctx.moveTo(x, y); ctx.lineTo(x + radius, y); ctx.closePath(); break; } ctx.stroke(); } } }); }; },{}],37:[function(require,module,exports){ "use strict"; module.exports = function(Chart) { var helpers = Chart.helpers, globalOpts = Chart.defaults.global; globalOpts.elements.rectangle = { backgroundColor: globalOpts.defaultColor, borderWidth: 0, borderColor: globalOpts.defaultColor, borderSkipped: 'bottom' }; Chart.elements.Rectangle = Chart.Element.extend({ draw: function() { var ctx = this._chart.ctx; var vm = this._view; var halfWidth = vm.width / 2, leftX = vm.x - halfWidth, rightX = vm.x + halfWidth, top = vm.base - (vm.base - vm.y), halfStroke = vm.borderWidth / 2; // Canvas doesn't allow us to stroke inside the width so we can // adjust the sizes to fit if we're setting a stroke on the line if (vm.borderWidth) { leftX += halfStroke; rightX -= halfStroke; top += halfStroke; } ctx.beginPath(); ctx.fillStyle = vm.backgroundColor; ctx.strokeStyle = vm.borderColor; ctx.lineWidth = vm.borderWidth; // Corner points, from bottom-left to bottom-right clockwise // | 1 2 | // | 0 3 | var corners = [ [leftX, vm.base], [leftX, top], [rightX, top], [rightX, vm.base] ]; // Find first (starting) corner with fallback to 'bottom' var borders = ['bottom', 'left', 'top', 'right']; var startCorner = borders.indexOf(vm.borderSkipped, 0); if (startCorner === -1) startCorner = 0; function cornerAt(index) { return corners[(startCorner + index) % 4]; } // Draw rectangle from 'startCorner' ctx.moveTo.apply(ctx, cornerAt(0)); for (var i = 1; i < 4; i++) ctx.lineTo.apply(ctx, cornerAt(i)); ctx.fill(); if (vm.borderWidth) { ctx.stroke(); } }, height: function() { var vm = this._view; return vm.base - vm.y; }, inRange: function(mouseX, mouseY) { var vm = this._view; return vm ? (vm.y < vm.base ? (mouseX >= vm.x - vm.width / 2 && mouseX <= vm.x + vm.width / 2) && (mouseY >= vm.y && mouseY <= vm.base) : (mouseX >= vm.x - vm.width / 2 && mouseX <= vm.x + vm.width / 2) && (mouseY >= vm.base && mouseY <= vm.y)) : false; }, inLabelRange: function(mouseX) { var vm = this._view; return vm ? (mouseX >= vm.x - vm.width / 2 && mouseX <= vm.x + vm.width / 2) : false; }, tooltipPosition: function() { var vm = this._view; return { x: vm.x, y: vm.y }; } }); }; },{}],38:[function(require,module,exports){ "use strict"; module.exports = function(Chart) { var helpers = Chart.helpers; // Default config for a category scale var defaultConfig = { position: "bottom" }; var DatasetScale = Chart.Scale.extend({ // Implement this so that determineDataLimits: function() { this.minIndex = 0; this.maxIndex = this.chart.data.labels.length - 1; var findIndex; if (this.options.ticks.min !== undefined) { // user specified min value findIndex = helpers.indexOf(this.chart.data.labels, this.options.ticks.min); this.minIndex = findIndex !== -1 ? findIndex : this.minIndex; } if (this.options.ticks.max !== undefined) { // user specified max value findIndex = helpers.indexOf(this.chart.data.labels, this.options.ticks.max); this.maxIndex = findIndex !== -1 ? findIndex : this.maxIndex; } this.min = this.chart.data.labels[this.minIndex]; this.max = this.chart.data.labels[this.maxIndex]; }, buildTicks: function(index) { // If we are viewing some subset of labels, slice the original array this.ticks = (this.minIndex === 0 && this.maxIndex === this.chart.data.labels.length - 1) ? this.chart.data.labels : this.chart.data.labels.slice(this.minIndex, this.maxIndex + 1); }, getLabelForIndex: function(index, datasetIndex) { return this.ticks[index]; }, // Used to get data value locations. Value can either be an index or a numerical value getPixelForValue: function(value, index, datasetIndex, includeOffset) { // 1 is added because we need the length but we have the indexes var offsetAmt = Math.max((this.maxIndex + 1 - this.minIndex - ((this.options.gridLines.offsetGridLines) ? 0 : 1)), 1); if (this.isHorizontal()) { var innerWidth = this.width - (this.paddingLeft + this.paddingRight); var valueWidth = innerWidth / offsetAmt; var widthOffset = (valueWidth * (index - this.minIndex)) + this.paddingLeft; if (this.options.gridLines.offsetGridLines && includeOffset) { widthOffset += (valueWidth / 2); } return this.left + Math.round(widthOffset); } else { var innerHeight = this.height - (this.paddingTop + this.paddingBottom); var valueHeight = innerHeight / offsetAmt; var heightOffset = (valueHeight * (index - this.minIndex)) + this.paddingTop; if (this.options.gridLines.offsetGridLines && includeOffset) { heightOffset += (valueHeight / 2); } return this.top + Math.round(heightOffset); } }, getPixelForTick: function(index, includeOffset) { return this.getPixelForValue(this.ticks[index], index + this.minIndex, null, includeOffset); }, getValueForPixel: function(pixel) { var value ; var offsetAmt = Math.max((this.ticks.length - ((this.options.gridLines.offsetGridLines) ? 0 : 1)), 1); var horz = this.isHorizontal(); var innerDimension = horz ? this.width - (this.paddingLeft + this.paddingRight) : this.height - (this.paddingTop + this.paddingBottom); var valueDimension = innerDimension / offsetAmt; if (this.options.gridLines.offsetGridLines) { pixel -= (valueDimension / 2); } pixel -= horz ? this.paddingLeft : this.paddingTop; if (pixel <= 0) { value = 0; } else { value = Math.round(pixel / valueDimension); } return value; } }); Chart.scaleService.registerScaleType("category", DatasetScale, defaultConfig); }; },{}],39:[function(require,module,exports){ "use strict"; module.exports = function(Chart) { var helpers = Chart.helpers; var defaultConfig = { position: "left", ticks: { callback: function(tickValue, index, ticks) { // If we have lots of ticks, don't use the ones var delta = ticks.length > 3 ? ticks[2] - ticks[1] : ticks[1] - ticks[0]; // If we have a number like 2.5 as the delta, figure out how many decimal places we need if (Math.abs(delta) > 1) { if (tickValue !== Math.floor(tickValue)) { // not an integer delta = tickValue - Math.floor(tickValue); } } var logDelta = helpers.log10(Math.abs(delta)); var tickString = ''; if (tickValue !== 0) { var numDecimal = -1 * Math.floor(logDelta); numDecimal = Math.max(Math.min(numDecimal, 20), 0); // toFixed has a max of 20 decimal places tickString = tickValue.toFixed(numDecimal); } else { tickString = '0'; // never show decimal places for 0 } return tickString; } } }; var LinearScale = Chart.Scale.extend({ determineDataLimits: function() { // First Calculate the range this.min = null; this.max = null; if (this.options.stacked) { var valuesPerType = {}; var hasPositiveValues = false; var hasNegativeValues = false; helpers.each(this.chart.data.datasets, function(dataset, datasetIndex) { var meta = this.chart.getDatasetMeta(datasetIndex); if (valuesPerType[meta.type] === undefined) { valuesPerType[meta.type] = { positiveValues: [], negativeValues: [] }; } // Store these per type var positiveValues = valuesPerType[meta.type].positiveValues; var negativeValues = valuesPerType[meta.type].negativeValues; if (this.chart.isDatasetVisible(datasetIndex) && (this.isHorizontal() ? meta.xAxisID === this.id : meta.yAxisID === this.id)) { helpers.each(dataset.data, function(rawValue, index) { var value = +this.getRightValue(rawValue); if (isNaN(value) || meta.data[index].hidden) { return; } positiveValues[index] = positiveValues[index] || 0; negativeValues[index] = negativeValues[index] || 0; if (this.options.relativePoints) { positiveValues[index] = 100; } else { if (value < 0) { hasNegativeValues = true; negativeValues[index] += value; } else { hasPositiveValues = true; positiveValues[index] += value; } } }, this); } }, this); helpers.each(valuesPerType, function(valuesForType) { var values = valuesForType.positiveValues.concat(valuesForType.negativeValues); var minVal = helpers.min(values); var maxVal = helpers.max(values); this.min = this.min === null ? minVal : Math.min(this.min, minVal); this.max = this.max === null ? maxVal : Math.max(this.max, maxVal); }, this); } else { helpers.each(this.chart.data.datasets, function(dataset, datasetIndex) { var meta = this.chart.getDatasetMeta(datasetIndex); if (this.chart.isDatasetVisible(datasetIndex) && (this.isHorizontal() ? meta.xAxisID === this.id : meta.yAxisID === this.id)) { helpers.each(dataset.data, function(rawValue, index) { var value = +this.getRightValue(rawValue); if (isNaN(value) || meta.data[index].hidden) { return; } if (this.min === null) { this.min = value; } else if (value < this.min) { this.min = value; } if (this.max === null) { this.max = value; } else if (value > this.max) { this.max = value; } }, this); } }, this); } // If we are forcing it to begin at 0, but 0 will already be rendered on the chart, // do nothing since that would make the chart weird. If the user really wants a weird chart // axis, they can manually override it if (this.options.ticks.beginAtZero) { var minSign = helpers.sign(this.min); var maxSign = helpers.sign(this.max); if (minSign < 0 && maxSign < 0) { // move the top up to 0 this.max = 0; } else if (minSign > 0 && maxSign > 0) { // move the botttom down to 0 this.min = 0; } } if (this.options.ticks.min !== undefined) { this.min = this.options.ticks.min; } else if (this.options.ticks.suggestedMin !== undefined) { this.min = Math.min(this.min, this.options.ticks.suggestedMin); } if (this.options.ticks.max !== undefined) { this.max = this.options.ticks.max; } else if (this.options.ticks.suggestedMax !== undefined) { this.max = Math.max(this.max, this.options.ticks.suggestedMax); } if (this.min === this.max) { this.max++; if (!this.options.ticks.beginAtZero) { this.min--; } } }, buildTicks: function() { // Then calulate the ticks this.ticks = []; // Figure out what the max number of ticks we can support it is based on the size of // the axis area. For now, we say that the minimum tick spacing in pixels must be 50 // We also limit the maximum number of ticks to 11 which gives a nice 10 squares on // the graph var maxTicks; if (this.isHorizontal()) { maxTicks = Math.min(this.options.ticks.maxTicksLimit ? this.options.ticks.maxTicksLimit : 11, Math.ceil(this.width / 50)); } else { // The factor of 2 used to scale the font size has been experimentally determined. var tickFontSize = helpers.getValueOrDefault(this.options.ticks.fontSize, Chart.defaults.global.defaultFontSize); maxTicks = Math.min(this.options.ticks.maxTicksLimit ? this.options.ticks.maxTicksLimit : 11, Math.ceil(this.height / (2 * tickFontSize))); } // Make sure we always have at least 2 ticks maxTicks = Math.max(2, maxTicks); // To get a "nice" value for the tick spacing, we will use the appropriately named // "nice number" algorithm. See http://stackoverflow.com/questions/8506881/nice-label-algorithm-for-charts-with-minimum-ticks // for details. var spacing; var fixedStepSizeSet = (this.options.ticks.fixedStepSize && this.options.ticks.fixedStepSize > 0) || (this.options.ticks.stepSize && this.options.ticks.stepSize > 0); if (fixedStepSizeSet) { spacing = helpers.getValueOrDefault(this.options.ticks.fixedStepSize, this.options.ticks.stepSize); } else { var niceRange = helpers.niceNum(this.max - this.min, false); spacing = helpers.niceNum(niceRange / (maxTicks - 1), true); } var niceMin = Math.floor(this.min / spacing) * spacing; var niceMax = Math.ceil(this.max / spacing) * spacing; var numSpaces = (niceMax - niceMin) / spacing; // If very close to our rounded value, use it. if (helpers.almostEquals(numSpaces, Math.round(numSpaces), spacing / 1000)) { numSpaces = Math.round(numSpaces); } else { numSpaces = Math.ceil(numSpaces); } // Put the values into the ticks array this.ticks.push(this.options.ticks.min !== undefined ? this.options.ticks.min : niceMin); for (var j = 1; j < numSpaces; ++j) { this.ticks.push(niceMin + (j * spacing)); } this.ticks.push(this.options.ticks.max !== undefined ? this.options.ticks.max : niceMax); if (this.options.position === "left" || this.options.position === "right") { // We are in a vertical orientation. The top value is the highest. So reverse the array this.ticks.reverse(); } // At this point, we need to update our max and min given the tick values since we have expanded the // range of the scale this.max = helpers.max(this.ticks); this.min = helpers.min(this.ticks); if (this.options.ticks.reverse) { this.ticks.reverse(); this.start = this.max; this.end = this.min; } else { this.start = this.min; this.end = this.max; } }, getLabelForIndex: function(index, datasetIndex) { return +this.getRightValue(this.chart.data.datasets[datasetIndex].data[index]); }, convertTicksToLabels: function() { this.ticksAsNumbers = this.ticks.slice(); this.zeroLineIndex = this.ticks.indexOf(0); Chart.Scale.prototype.convertTicksToLabels.call(this); }, // Utils getPixelForValue: function(value, index, datasetIndex, includeOffset) { // This must be called after fit has been run so that // this.left, this.top, this.right, and this.bottom have been defined var rightValue = +this.getRightValue(value); var pixel; var range = this.end - this.start; if (this.isHorizontal()) { var innerWidth = this.width - (this.paddingLeft + this.paddingRight); pixel = this.left + (innerWidth / range * (rightValue - this.start)); return Math.round(pixel + this.paddingLeft); } else { var innerHeight = this.height - (this.paddingTop + this.paddingBottom); pixel = (this.bottom - this.paddingBottom) - (innerHeight / range * (rightValue - this.start)); return Math.round(pixel); } }, getValueForPixel: function(pixel) { var offset; if (this.isHorizontal()) { var innerWidth = this.width - (this.paddingLeft + this.paddingRight); offset = (pixel - this.left - this.paddingLeft) / innerWidth; } else { var innerHeight = this.height - (this.paddingTop + this.paddingBottom); offset = (this.bottom - this.paddingBottom - pixel) / innerHeight; } return this.start + ((this.end - this.start) * offset); }, getPixelForTick: function(index, includeOffset) { return this.getPixelForValue(this.ticksAsNumbers[index], null, null, includeOffset); } }); Chart.scaleService.registerScaleType("linear", LinearScale, defaultConfig); }; },{}],40:[function(require,module,exports){ "use strict"; module.exports = function(Chart) { var helpers = Chart.helpers; var defaultConfig = { position: "left", // label settings ticks: { callback: function(value, index, arr) { var remain = value / (Math.pow(10, Math.floor(Chart.helpers.log10(value)))); if (remain === 1 || remain === 2 || remain === 5 || index === 0 || index === arr.length - 1) { return value.toExponential(); } else { return ''; } } } }; var LogarithmicScale = Chart.Scale.extend({ determineDataLimits: function() { // Calculate Range this.min = null; this.max = null; if (this.options.stacked) { var valuesPerType = {}; helpers.each(this.chart.data.datasets, function(dataset, datasetIndex) { var meta = this.chart.getDatasetMeta(datasetIndex); if (this.chart.isDatasetVisible(datasetIndex) && (this.isHorizontal() ? meta.xAxisID === this.id : meta.yAxisID === this.id)) { if (valuesPerType[meta.type] === undefined) { valuesPerType[meta.type] = []; } helpers.each(dataset.data, function(rawValue, index) { var values = valuesPerType[meta.type]; var value = +this.getRightValue(rawValue); if (isNaN(value) || meta.data[index].hidden) { return; } values[index] = values[index] || 0; if (this.options.relativePoints) { values[index] = 100; } else { // Don't need to split positive and negative since the log scale can't handle a 0 crossing values[index] += value; } }, this); } }, this); helpers.each(valuesPerType, function(valuesForType) { var minVal = helpers.min(valuesForType); var maxVal = helpers.max(valuesForType); this.min = this.min === null ? minVal : Math.min(this.min, minVal); this.max = this.max === null ? maxVal : Math.max(this.max, maxVal); }, this); } else { helpers.each(this.chart.data.datasets, function(dataset, datasetIndex) { var meta = this.chart.getDatasetMeta(datasetIndex); if (this.chart.isDatasetVisible(datasetIndex) && (this.isHorizontal() ? meta.xAxisID === this.id : meta.yAxisID === this.id)) { helpers.each(dataset.data, function(rawValue, index) { var value = +this.getRightValue(rawValue); if (isNaN(value) || meta.data[index].hidden) { return; } if (this.min === null) { this.min = value; } else if (value < this.min) { this.min = value; } if (this.max === null) { this.max = value; } else if (value > this.max) { this.max = value; } }, this); } }, this); } this.min = this.options.ticks.min !== undefined ? this.options.ticks.min : this.min; this.max = this.options.ticks.max !== undefined ? this.options.ticks.max : this.max; if (this.min === this.max) { if (this.min !== 0 && this.min !== null) { this.min = Math.pow(10, Math.floor(helpers.log10(this.min)) - 1); this.max = Math.pow(10, Math.floor(helpers.log10(this.max)) + 1); } else { this.min = 1; this.max = 10; } } }, buildTicks: function() { // Reset the ticks array. Later on, we will draw a grid line at these positions // The array simply contains the numerical value of the spots where ticks will be this.ticks = []; // Figure out what the max number of ticks we can support it is based on the size of // the axis area. For now, we say that the minimum tick spacing in pixels must be 50 // We also limit the maximum number of ticks to 11 which gives a nice 10 squares on // the graph var tickVal = this.options.ticks.min !== undefined ? this.options.ticks.min : Math.pow(10, Math.floor(helpers.log10(this.min))); while (tickVal < this.max) { this.ticks.push(tickVal); var exp = Math.floor(helpers.log10(tickVal)); var significand = Math.floor(tickVal / Math.pow(10, exp)) + 1; if (significand === 10) { significand = 1; ++exp; } tickVal = significand * Math.pow(10, exp); } var lastTick = this.options.ticks.max !== undefined ? this.options.ticks.max : tickVal; this.ticks.push(lastTick); if (this.options.position === "left" || this.options.position === "right") { // We are in a vertical orientation. The top value is the highest. So reverse the array this.ticks.reverse(); } // At this point, we need to update our max and min given the tick values since we have expanded the // range of the scale this.max = helpers.max(this.ticks); this.min = helpers.min(this.ticks); if (this.options.ticks.reverse) { this.ticks.reverse(); this.start = this.max; this.end = this.min; } else { this.start = this.min; this.end = this.max; } }, convertTicksToLabels: function() { this.tickValues = this.ticks.slice(); Chart.Scale.prototype.convertTicksToLabels.call(this); }, // Get the correct tooltip label getLabelForIndex: function(index, datasetIndex) { return +this.getRightValue(this.chart.data.datasets[datasetIndex].data[index]); }, getPixelForTick: function(index, includeOffset) { return this.getPixelForValue(this.tickValues[index], null, null, includeOffset); }, getPixelForValue: function(value, index, datasetIndex, includeOffset) { var pixel; var newVal = +this.getRightValue(value) ; var range = helpers.log10(this.end) - helpers.log10(this.start); if (this.isHorizontal()) { if (newVal === 0) { pixel = this.left + this.paddingLeft; } else { var innerWidth = this.width - (this.paddingLeft + this.paddingRight); pixel = this.left + (innerWidth / range * (helpers.log10(newVal) - helpers.log10(this.start))); pixel += this.paddingLeft; } } else { // Bottom - top since pixels increase downard on a screen if (newVal === 0) { pixel = this.top + this.paddingTop; } else { var innerHeight = this.height - (this.paddingTop + this.paddingBottom); pixel = (this.bottom - this.paddingBottom) - (innerHeight / range * (helpers.log10(newVal) - helpers.log10(this.start))); } } return pixel; }, getValueForPixel: function(pixel) { var offset; var range = helpers.log10(this.end) - helpers.log10(this.start); var value; if (this.isHorizontal()) { var innerWidth = this.width - (this.paddingLeft + this.paddingRight); value = this.start * Math.pow(10, (pixel - this.left - this.paddingLeft) * range / innerWidth); } else { var innerHeight = this.height - (this.paddingTop + this.paddingBottom); value = Math.pow(10, (this.bottom - this.paddingBottom - pixel) * range / innerHeight) / this.start; } return value; } }); Chart.scaleService.registerScaleType("logarithmic", LogarithmicScale, defaultConfig); }; },{}],41:[function(require,module,exports){ "use strict"; module.exports = function(Chart) { var helpers = Chart.helpers; var defaultConfig = { display: true, //Boolean - Whether to animate scaling the chart from the centre animate: true, lineArc: false, position: "chartArea", angleLines: { display: true, color: "rgba(0, 0, 0, 0.1)", lineWidth: 1 }, // label settings ticks: { //Boolean - Show a backdrop to the scale label showLabelBackdrop: true, //String - The colour of the label backdrop backdropColor: "rgba(255,255,255,0.75)", //Number - The backdrop padding above & below the label in pixels backdropPaddingY: 2, //Number - The backdrop padding to the side of the label in pixels backdropPaddingX: 2 }, pointLabels: { //Number - Point label font size in pixels fontSize: 10, //Function - Used to convert point labels callback: function(label) { return label; } } }; var LinearRadialScale = Chart.Scale.extend({ getValueCount: function() { return this.chart.data.labels.length; }, setDimensions: function() { // Set the unconstrained dimension before label rotation this.width = this.maxWidth; this.height = this.maxHeight; this.xCenter = Math.round(this.width / 2); this.yCenter = Math.round(this.height / 2); var minSize = helpers.min([this.height, this.width]); var tickFontSize = helpers.getValueOrDefault(this.options.ticks.fontSize, Chart.defaults.global.defaultFontSize); this.drawingArea = (this.options.display) ? (minSize / 2) - (tickFontSize / 2 + this.options.ticks.backdropPaddingY) : (minSize / 2); }, determineDataLimits: function() { this.min = null; this.max = null; helpers.each(this.chart.data.datasets, function(dataset, datasetIndex) { if (this.chart.isDatasetVisible(datasetIndex)) { var meta = this.chart.getDatasetMeta(datasetIndex); helpers.each(dataset.data, function(rawValue, index) { var value = +this.getRightValue(rawValue); if (isNaN(value) || meta.data[index].hidden) { return; } if (this.min === null) { this.min = value; } else if (value < this.min) { this.min = value; } if (this.max === null) { this.max = value; } else if (value > this.max) { this.max = value; } }, this); } }, this); // If we are forcing it to begin at 0, but 0 will already be rendered on the chart, // do nothing since that would make the chart weird. If the user really wants a weird chart // axis, they can manually override it if (this.options.ticks.beginAtZero) { var minSign = helpers.sign(this.min); var maxSign = helpers.sign(this.max); if (minSign < 0 && maxSign < 0) { // move the top up to 0 this.max = 0; } else if (minSign > 0 && maxSign > 0) { // move the botttom down to 0 this.min = 0; } } if (this.options.ticks.min !== undefined) { this.min = this.options.ticks.min; } else if (this.options.ticks.suggestedMin !== undefined) { this.min = Math.min(this.min, this.options.ticks.suggestedMin); } if (this.options.ticks.max !== undefined) { this.max = this.options.ticks.max; } else if (this.options.ticks.suggestedMax !== undefined) { this.max = Math.max(this.max, this.options.ticks.suggestedMax); } if (this.min === this.max) { this.min--; this.max++; } }, buildTicks: function() { this.ticks = []; // Figure out what the max number of ticks we can support it is based on the size of // the axis area. For now, we say that the minimum tick spacing in pixels must be 50 // We also limit the maximum number of ticks to 11 which gives a nice 10 squares on // the graph var tickFontSize = helpers.getValueOrDefault(this.options.ticks.fontSize, Chart.defaults.global.defaultFontSize); var maxTicks = Math.min(this.options.ticks.maxTicksLimit ? this.options.ticks.maxTicksLimit : 11, Math.ceil(this.drawingArea / (1.5 * tickFontSize))); maxTicks = Math.max(2, maxTicks); // Make sure we always have at least 2 ticks // To get a "nice" value for the tick spacing, we will use the appropriately named // "nice number" algorithm. See http://stackoverflow.com/questions/8506881/nice-label-algorithm-for-charts-with-minimum-ticks // for details. var niceRange = helpers.niceNum(this.max - this.min, false); var spacing = helpers.niceNum(niceRange / (maxTicks - 1), true); var niceMin = Math.floor(this.min / spacing) * spacing; var niceMax = Math.ceil(this.max / spacing) * spacing; var numSpaces = Math.ceil((niceMax - niceMin) / spacing); // Put the values into the ticks array this.ticks.push(this.options.ticks.min !== undefined ? this.options.ticks.min : niceMin); for (var j = 1; j < numSpaces; ++j) { this.ticks.push(niceMin + (j * spacing)); } this.ticks.push(this.options.ticks.max !== undefined ? this.options.ticks.max : niceMax); // At this point, we need to update our max and min given the tick values since we have expanded the // range of the scale this.max = helpers.max(this.ticks); this.min = helpers.min(this.ticks); if (this.options.ticks.reverse) { this.ticks.reverse(); this.start = this.max; this.end = this.min; } else { this.start = this.min; this.end = this.max; } this.zeroLineIndex = this.ticks.indexOf(0); }, convertTicksToLabels: function() { Chart.Scale.prototype.convertTicksToLabels.call(this); // Point labels this.pointLabels = this.chart.data.labels.map(this.options.pointLabels.callback, this); }, getLabelForIndex: function(index, datasetIndex) { return +this.getRightValue(this.chart.data.datasets[datasetIndex].data[index]); }, fit: function() { /* * Right, this is really confusing and there is a lot of maths going on here * The gist of the problem is here: https://gist.github.com/nnnick/696cc9c55f4b0beb8fe9 * * Reaction: https://dl.dropboxusercontent.com/u/34601363/toomuchscience.gif * * Solution: * * We assume the radius of the polygon is half the size of the canvas at first * at each index we check if the text overlaps. * * Where it does, we store that angle and that index. * * After finding the largest index and angle we calculate how much we need to remove * from the shape radius to move the point inwards by that x. * * We average the left and right distances to get the maximum shape radius that can fit in the box * along with labels. * * Once we have that, we can find the centre point for the chart, by taking the x text protrusion * on each side, removing that from the size, halving it and adding the left x protrusion width. * * This will mean we have a shape fitted to the canvas, as large as it can be with the labels * and position it in the most space efficient manner * * https://dl.dropboxusercontent.com/u/34601363/yeahscience.gif */ var pointLabelFontSize = helpers.getValueOrDefault(this.options.pointLabels.fontSize, Chart.defaults.global.defaultFontSize); var pointLabeFontStyle = helpers.getValueOrDefault(this.options.pointLabels.fontStyle, Chart.defaults.global.defaultFontStyle); var pointLabeFontFamily = helpers.getValueOrDefault(this.options.pointLabels.fontFamily, Chart.defaults.global.defaultFontFamily); var pointLabeFont = helpers.fontString(pointLabelFontSize, pointLabeFontStyle, pointLabeFontFamily); // Get maximum radius of the polygon. Either half the height (minus the text width) or half the width. // Use this to calculate the offset + change. - Make sure L/R protrusion is at least 0 to stop issues with centre points var largestPossibleRadius = helpers.min([(this.height / 2 - pointLabelFontSize - 5), this.width / 2]), pointPosition, i, textWidth, halfTextWidth, furthestRight = this.width, furthestRightIndex, furthestRightAngle, furthestLeft = 0, furthestLeftIndex, furthestLeftAngle, xProtrusionLeft, xProtrusionRight, radiusReductionRight, radiusReductionLeft, maxWidthRadius; this.ctx.font = pointLabeFont; for (i = 0; i < this.getValueCount(); i++) { // 5px to space the text slightly out - similar to what we do in the draw function. pointPosition = this.getPointPosition(i, largestPossibleRadius); textWidth = this.ctx.measureText(this.pointLabels[i] ? this.pointLabels[i] : '').width + 5; if (i === 0 || i === this.getValueCount() / 2) { // If we're at index zero, or exactly the middle, we're at exactly the top/bottom // of the radar chart, so text will be aligned centrally, so we'll half it and compare // w/left and right text sizes halfTextWidth = textWidth / 2; if (pointPosition.x + halfTextWidth > furthestRight) { furthestRight = pointPosition.x + halfTextWidth; furthestRightIndex = i; } if (pointPosition.x - halfTextWidth < furthestLeft) { furthestLeft = pointPosition.x - halfTextWidth; furthestLeftIndex = i; } } else if (i < this.getValueCount() / 2) { // Less than half the values means we'll left align the text if (pointPosition.x + textWidth > furthestRight) { furthestRight = pointPosition.x + textWidth; furthestRightIndex = i; } } else if (i > this.getValueCount() / 2) { // More than half the values means we'll right align the text if (pointPosition.x - textWidth < furthestLeft) { furthestLeft = pointPosition.x - textWidth; furthestLeftIndex = i; } } } xProtrusionLeft = furthestLeft; xProtrusionRight = Math.ceil(furthestRight - this.width); furthestRightAngle = this.getIndexAngle(furthestRightIndex); furthestLeftAngle = this.getIndexAngle(furthestLeftIndex); radiusReductionRight = xProtrusionRight / Math.sin(furthestRightAngle + Math.PI / 2); radiusReductionLeft = xProtrusionLeft / Math.sin(furthestLeftAngle + Math.PI / 2); // Ensure we actually need to reduce the size of the chart radiusReductionRight = (helpers.isNumber(radiusReductionRight)) ? radiusReductionRight : 0; radiusReductionLeft = (helpers.isNumber(radiusReductionLeft)) ? radiusReductionLeft : 0; this.drawingArea = Math.round(largestPossibleRadius - (radiusReductionLeft + radiusReductionRight) / 2); this.setCenterPoint(radiusReductionLeft, radiusReductionRight); }, setCenterPoint: function(leftMovement, rightMovement) { var maxRight = this.width - rightMovement - this.drawingArea, maxLeft = leftMovement + this.drawingArea; this.xCenter = Math.round(((maxLeft + maxRight) / 2) + this.left); // Always vertically in the centre as the text height doesn't change this.yCenter = Math.round((this.height / 2) + this.top); }, getIndexAngle: function(index) { var angleMultiplier = (Math.PI * 2) / this.getValueCount(); // Start from the top instead of right, so remove a quarter of the circle return index * angleMultiplier - (Math.PI / 2); }, getDistanceFromCenterForValue: function(value) { if (value === null) { return 0; // null always in center } // Take into account half font size + the yPadding of the top value var scalingFactor = this.drawingArea / (this.max - this.min); if (this.options.reverse) { return (this.max - value) * scalingFactor; } else { return (value - this.min) * scalingFactor; } }, getPointPosition: function(index, distanceFromCenter) { var thisAngle = this.getIndexAngle(index); return { x: Math.round(Math.cos(thisAngle) * distanceFromCenter) + this.xCenter, y: Math.round(Math.sin(thisAngle) * distanceFromCenter) + this.yCenter }; }, getPointPositionForValue: function(index, value) { return this.getPointPosition(index, this.getDistanceFromCenterForValue(value)); }, draw: function() { if (this.options.display) { var ctx = this.ctx; helpers.each(this.ticks, function(label, index) { // Don't draw a centre value (if it is minimum) if (index > 0 || this.options.reverse) { var yCenterOffset = this.getDistanceFromCenterForValue(this.ticks[index]); var yHeight = this.yCenter - yCenterOffset; // Draw circular lines around the scale if (this.options.gridLines.display) { ctx.strokeStyle = this.options.gridLines.color; ctx.lineWidth = this.options.gridLines.lineWidth; if (this.options.lineArc) { // Draw circular arcs between the points ctx.beginPath(); ctx.arc(this.xCenter, this.yCenter, yCenterOffset, 0, Math.PI * 2); ctx.closePath(); ctx.stroke(); } else { // Draw straight lines connecting each index ctx.beginPath(); for (var i = 0; i < this.getValueCount(); i++) { var pointPosition = this.getPointPosition(i, this.getDistanceFromCenterForValue(this.ticks[index])); if (i === 0) { ctx.moveTo(pointPosition.x, pointPosition.y); } else { ctx.lineTo(pointPosition.x, pointPosition.y); } } ctx.closePath(); ctx.stroke(); } } if (this.options.ticks.display) { var tickFontColor = helpers.getValueOrDefault(this.options.ticks.fontColor, Chart.defaults.global.defaultFontColor); var tickFontSize = helpers.getValueOrDefault(this.options.ticks.fontSize, Chart.defaults.global.defaultFontSize); var tickFontStyle = helpers.getValueOrDefault(this.options.ticks.fontStyle, Chart.defaults.global.defaultFontStyle); var tickFontFamily = helpers.getValueOrDefault(this.options.ticks.fontFamily, Chart.defaults.global.defaultFontFamily); var tickLabelFont = helpers.fontString(tickFontSize, tickFontStyle, tickFontFamily); ctx.font = tickLabelFont; if (this.options.ticks.showLabelBackdrop) { var labelWidth = ctx.measureText(label).width; ctx.fillStyle = this.options.ticks.backdropColor; ctx.fillRect( this.xCenter - labelWidth / 2 - this.options.ticks.backdropPaddingX, yHeight - tickFontSize / 2 - this.options.ticks.backdropPaddingY, labelWidth + this.options.ticks.backdropPaddingX * 2, tickFontSize + this.options.ticks.backdropPaddingY * 2 ); } ctx.textAlign = 'center'; ctx.textBaseline = "middle"; ctx.fillStyle = tickFontColor; ctx.fillText(label, this.xCenter, yHeight); } } }, this); if (!this.options.lineArc) { ctx.lineWidth = this.options.angleLines.lineWidth; ctx.strokeStyle = this.options.angleLines.color; for (var i = this.getValueCount() - 1; i >= 0; i--) { if (this.options.angleLines.display) { var outerPosition = this.getPointPosition(i, this.getDistanceFromCenterForValue(this.options.reverse ? this.min : this.max)); ctx.beginPath(); ctx.moveTo(this.xCenter, this.yCenter); ctx.lineTo(outerPosition.x, outerPosition.y); ctx.stroke(); ctx.closePath(); } // Extra 3px out for some label spacing var pointLabelPosition = this.getPointPosition(i, this.getDistanceFromCenterForValue(this.options.reverse ? this.min : this.max) + 5); var pointLabelFontColor = helpers.getValueOrDefault(this.options.pointLabels.fontColor, Chart.defaults.global.defaultFontColor); var pointLabelFontSize = helpers.getValueOrDefault(this.options.pointLabels.fontSize, Chart.defaults.global.defaultFontSize); var pointLabeFontStyle = helpers.getValueOrDefault(this.options.pointLabels.fontStyle, Chart.defaults.global.defaultFontStyle); var pointLabeFontFamily = helpers.getValueOrDefault(this.options.pointLabels.fontFamily, Chart.defaults.global.defaultFontFamily); var pointLabeFont = helpers.fontString(pointLabelFontSize, pointLabeFontStyle, pointLabeFontFamily); ctx.font = pointLabeFont; ctx.fillStyle = pointLabelFontColor; var labelsCount = this.pointLabels.length, halfLabelsCount = this.pointLabels.length / 2, quarterLabelsCount = halfLabelsCount / 2, upperHalf = (i < quarterLabelsCount || i > labelsCount - quarterLabelsCount), exactQuarter = (i === quarterLabelsCount || i === labelsCount - quarterLabelsCount); if (i === 0) { ctx.textAlign = 'center'; } else if (i === halfLabelsCount) { ctx.textAlign = 'center'; } else if (i < halfLabelsCount) { ctx.textAlign = 'left'; } else { ctx.textAlign = 'right'; } // Set the correct text baseline based on outer positioning if (exactQuarter) { ctx.textBaseline = 'middle'; } else if (upperHalf) { ctx.textBaseline = 'bottom'; } else { ctx.textBaseline = 'top'; } ctx.fillText(this.pointLabels[i] ? this.pointLabels[i] : '', pointLabelPosition.x, pointLabelPosition.y); } } } } }); Chart.scaleService.registerScaleType("radialLinear", LinearRadialScale, defaultConfig); }; },{}],42:[function(require,module,exports){ /*global window: false */ "use strict"; var moment = require('moment'); moment = typeof(moment) === 'function' ? moment : window.moment; module.exports = function(Chart) { var helpers = Chart.helpers; var time = { units: [{ name: 'millisecond', steps: [1, 2, 5, 10, 20, 50, 100, 250, 500] }, { name: 'second', steps: [1, 2, 5, 10, 30] }, { name: 'minute', steps: [1, 2, 5, 10, 30] }, { name: 'hour', steps: [1, 2, 3, 6, 12] }, { name: 'day', steps: [1, 2, 5] }, { name: 'week', maxStep: 4 }, { name: 'month', maxStep: 3 }, { name: 'quarter', maxStep: 4 }, { name: 'year', maxStep: false }] }; var defaultConfig = { position: "bottom", time: { parser: false, // false == a pattern string from http://momentjs.com/docs/#/parsing/string-format/ or a custom callback that converts its argument to a moment format: false, // DEPRECATED false == date objects, moment object, callback or a pattern string from http://momentjs.com/docs/#/parsing/string-format/ unit: false, // false == automatic or override with week, month, year, etc. round: false, // none, or override with week, month, year, etc. displayFormat: false, // DEPRECATED // defaults to unit's corresponding unitFormat below or override using pattern string from http://momentjs.com/docs/#/displaying/format/ displayFormats: { 'millisecond': 'h:mm:ss.SSS a', // 11:20:01.123 AM, 'second': 'h:mm:ss a', // 11:20:01 AM 'minute': 'h:mm:ss a', // 11:20:01 AM 'hour': 'MMM D, hA', // Sept 4, 5PM 'day': 'll', // Sep 4 2015 'week': 'll', // Week 46, or maybe "[W]WW - YYYY" ? 'month': 'MMM YYYY', // Sept 2015 'quarter': '[Q]Q - YYYY', // Q3 'year': 'YYYY' // 2015 } }, ticks: { autoSkip: false } }; var TimeScale = Chart.Scale.extend({ initialize: function() { if (!moment) { throw new Error('Chart.js - Moment.js could not be found! You must include it before Chart.js to use the time scale. Download at https://momentjs.com'); } Chart.Scale.prototype.initialize.call(this); }, getLabelMoment: function(datasetIndex, index) { return this.labelMoments[datasetIndex][index]; }, determineDataLimits: function() { this.labelMoments = []; // Only parse these once. If the dataset does not have data as x,y pairs, we will use // these var scaleLabelMoments = []; if (this.chart.data.labels && this.chart.data.labels.length > 0) { helpers.each(this.chart.data.labels, function(label, index) { var labelMoment = this.parseTime(label); if (labelMoment.isValid()) { if (this.options.time.round) { labelMoment.startOf(this.options.time.round); } scaleLabelMoments.push(labelMoment); } }, this); this.firstTick = moment.min.call(this, scaleLabelMoments); this.lastTick = moment.max.call(this, scaleLabelMoments); } else { this.firstTick = null; this.lastTick = null; } helpers.each(this.chart.data.datasets, function(dataset, datasetIndex) { var momentsForDataset = []; var datasetVisible = this.chart.isDatasetVisible(datasetIndex); if (typeof dataset.data[0] === 'object') { helpers.each(dataset.data, function(value, index) { var labelMoment = this.parseTime(this.getRightValue(value)); if (labelMoment.isValid()) { if (this.options.time.round) { labelMoment.startOf(this.options.time.round); } momentsForDataset.push(labelMoment); if (datasetVisible) { // May have gone outside the scale ranges, make sure we keep the first and last ticks updated this.firstTick = this.firstTick !== null ? moment.min(this.firstTick, labelMoment) : labelMoment; this.lastTick = this.lastTick !== null ? moment.max(this.lastTick, labelMoment) : labelMoment; } } }, this); } else { // We have no labels. Use the ones from the scale momentsForDataset = scaleLabelMoments; } this.labelMoments.push(momentsForDataset); }, this); // Set these after we've done all the data if (this.options.time.min) { this.firstTick = this.parseTime(this.options.time.min); } if (this.options.time.max) { this.lastTick = this.parseTime(this.options.time.max); } // We will modify these, so clone for later this.firstTick = (this.firstTick || moment()).clone(); this.lastTick = (this.lastTick || moment()).clone(); }, buildTicks: function(index) { this.ctx.save(); var tickFontSize = helpers.getValueOrDefault(this.options.ticks.fontSize, Chart.defaults.global.defaultFontSize); var tickFontStyle = helpers.getValueOrDefault(this.options.ticks.fontStyle, Chart.defaults.global.defaultFontStyle); var tickFontFamily = helpers.getValueOrDefault(this.options.ticks.fontFamily, Chart.defaults.global.defaultFontFamily); var tickLabelFont = helpers.fontString(tickFontSize, tickFontStyle, tickFontFamily); this.ctx.font = tickLabelFont; this.ticks = []; this.unitScale = 1; // How much we scale the unit by, ie 2 means 2x unit per step this.scaleSizeInUnits = 0; // How large the scale is in the base unit (seconds, minutes, etc) // Set unit override if applicable if (this.options.time.unit) { this.tickUnit = this.options.time.unit || 'day'; this.displayFormat = this.options.time.displayFormats[this.tickUnit]; this.scaleSizeInUnits = this.lastTick.diff(this.firstTick, this.tickUnit, true); this.unitScale = helpers.getValueOrDefault(this.options.time.unitStepSize, 1); } else { // Determine the smallest needed unit of the time var innerWidth = this.isHorizontal() ? this.width - (this.paddingLeft + this.paddingRight) : this.height - (this.paddingTop + this.paddingBottom); // Crude approximation of what the label length might be var tempFirstLabel = this.tickFormatFunction(this.firstTick, 0, []); var tickLabelWidth = this.ctx.measureText(tempFirstLabel).width; var cosRotation = Math.cos(helpers.toRadians(this.options.ticks.maxRotation)); var sinRotation = Math.sin(helpers.toRadians(this.options.ticks.maxRotation)); tickLabelWidth = (tickLabelWidth * cosRotation) + (tickFontSize * sinRotation); var labelCapacity = innerWidth / (tickLabelWidth); // Start as small as possible this.tickUnit = 'millisecond'; this.scaleSizeInUnits = this.lastTick.diff(this.firstTick, this.tickUnit, true); this.displayFormat = this.options.time.displayFormats[this.tickUnit]; var unitDefinitionIndex = 0; var unitDefinition = time.units[unitDefinitionIndex]; // While we aren't ideal and we don't have units left while (unitDefinitionIndex < time.units.length) { // Can we scale this unit. If `false` we can scale infinitely this.unitScale = 1; if (helpers.isArray(unitDefinition.steps) && Math.ceil(this.scaleSizeInUnits / labelCapacity) < helpers.max(unitDefinition.steps)) { // Use one of the prefedined steps for (var idx = 0; idx < unitDefinition.steps.length; ++idx) { if (unitDefinition.steps[idx] >= Math.ceil(this.scaleSizeInUnits / labelCapacity)) { this.unitScale = helpers.getValueOrDefault(this.options.time.unitStepSize, unitDefinition.steps[idx]); break; } } break; } else if ((unitDefinition.maxStep === false) || (Math.ceil(this.scaleSizeInUnits / labelCapacity) < unitDefinition.maxStep)) { // We have a max step. Scale this unit this.unitScale = helpers.getValueOrDefault(this.options.time.unitStepSize, Math.ceil(this.scaleSizeInUnits / labelCapacity)); break; } else { // Move to the next unit up ++unitDefinitionIndex; unitDefinition = time.units[unitDefinitionIndex]; this.tickUnit = unitDefinition.name; var leadingUnitBuffer = this.firstTick.diff(this.firstTick.clone().startOf(this.tickUnit), this.tickUnit, true); var trailingUnitBuffer = this.lastTick.clone().add(1, this.tickUnit).startOf(this.tickUnit).diff(this.lastTick, this.tickUnit, true); this.scaleSizeInUnits = this.lastTick.diff(this.firstTick, this.tickUnit, true) + leadingUnitBuffer + trailingUnitBuffer; this.displayFormat = this.options.time.displayFormats[unitDefinition.name]; } } } var roundedStart; // Only round the first tick if we have no hard minimum if (!this.options.time.min) { this.firstTick.startOf(this.tickUnit); roundedStart = this.firstTick; } else { roundedStart = this.firstTick.clone().startOf(this.tickUnit); } // Only round the last tick if we have no hard maximum if (!this.options.time.max) { var roundedEnd = this.lastTick.clone().startOf(this.tickUnit); if (roundedEnd.diff(this.lastTick, this.tickUnit, true) !== 0) { // Do not use end of because we need this to be in the next time unit this.lastTick.add(1, this.tickUnit).startOf(this.tickUnit); } } this.smallestLabelSeparation = this.width; helpers.each(this.chart.data.datasets, function(dataset, datasetIndex) { for (var i = 1; i < this.labelMoments[datasetIndex].length; i++) { this.smallestLabelSeparation = Math.min(this.smallestLabelSeparation, this.labelMoments[datasetIndex][i].diff(this.labelMoments[datasetIndex][i - 1], this.tickUnit, true)); } }, this); // Tick displayFormat override if (this.options.time.displayFormat) { this.displayFormat = this.options.time.displayFormat; } // first tick. will have been rounded correctly if options.time.min is not specified this.ticks.push(this.firstTick.clone()); // For every unit in between the first and last moment, create a moment and add it to the ticks tick for (var i = 1; i <= this.scaleSizeInUnits; ++i) { var newTick = roundedStart.clone().add(i, this.tickUnit); // Are we greater than the max time if (this.options.time.max && newTick.diff(this.lastTick, this.tickUnit, true) >= 0) { break; } if (i % this.unitScale === 0) { this.ticks.push(newTick); } } // Always show the right tick var diff = this.ticks[this.ticks.length - 1].diff(this.lastTick, this.tickUnit); if (diff !== 0 || this.scaleSizeInUnits === 0) { // this is a weird case. If the <max> option is the same as the end option, we can't just diff the times because the tick was created from the roundedStart // but the last tick was not rounded. if (this.options.time.max) { this.ticks.push(this.lastTick.clone()); this.scaleSizeInUnits = this.lastTick.diff(this.ticks[0], this.tickUnit, true); } else { this.ticks.push(this.lastTick.clone()); this.scaleSizeInUnits = this.lastTick.diff(this.firstTick, this.tickUnit, true); } } this.ctx.restore(); }, // Get tooltip label getLabelForIndex: function(index, datasetIndex) { var label = this.chart.data.labels && index < this.chart.data.labels.length ? this.chart.data.labels[index] : ''; if (typeof this.chart.data.datasets[datasetIndex].data[0] === 'object') { label = this.getRightValue(this.chart.data.datasets[datasetIndex].data[index]); } // Format nicely if (this.options.time.tooltipFormat) { label = this.parseTime(label).format(this.options.time.tooltipFormat); } return label; }, // Function to format an individual tick mark tickFormatFunction: function tickFormatFunction(tick, index, ticks) { var formattedTick = tick.format(this.displayFormat); if (this.options.ticks.userCallback) { return this.options.ticks.userCallback(formattedTick, index, ticks); } else { return formattedTick; } }, convertTicksToLabels: function() { this.tickMoments = this.ticks; this.ticks = this.ticks.map(this.tickFormatFunction, this); }, getPixelForValue: function(value, index, datasetIndex, includeOffset) { var labelMoment = value && value.isValid && value.isValid() ? value : this.getLabelMoment(datasetIndex, index); if (labelMoment) { var offset = labelMoment.diff(this.firstTick, this.tickUnit, true); var decimal = offset / this.scaleSizeInUnits; if (this.isHorizontal()) { var innerWidth = this.width - (this.paddingLeft + this.paddingRight); var valueWidth = innerWidth / Math.max(this.ticks.length - 1, 1); var valueOffset = (innerWidth * decimal) + this.paddingLeft; return this.left + Math.round(valueOffset); } else { var innerHeight = this.height - (this.paddingTop + this.paddingBottom); var valueHeight = innerHeight / Math.max(this.ticks.length - 1, 1); var heightOffset = (innerHeight * decimal) + this.paddingTop; return this.top + Math.round(heightOffset); } } }, getPixelForTick: function(index, includeOffset) { return this.getPixelForValue(this.tickMoments[index], null, null, includeOffset); }, getValueForPixel: function(pixel) { var innerDimension = this.isHorizontal() ? this.width - (this.paddingLeft + this.paddingRight) : this.height - (this.paddingTop + this.paddingBottom); var offset = (pixel - (this.isHorizontal() ? this.left + this.paddingLeft : this.top + this.paddingTop)) / innerDimension; offset *= this.scaleSizeInUnits; return this.firstTick.clone().add(moment.duration(offset, this.tickUnit).asSeconds(), 'seconds'); }, parseTime: function(label) { if (typeof this.options.time.parser === 'string') { return moment(label, this.options.time.parser); } if (typeof this.options.time.parser === 'function') { return this.options.time.parser(label); } // Date objects if (typeof label.getMonth === 'function' || typeof label === 'number') { return moment(label); } // Moment support if (label.isValid && label.isValid()) { return label; } // Custom parsing (return an instance of moment) if (typeof this.options.time.format !== 'string' && this.options.time.format.call) { console.warn("options.time.format is deprecated and replaced by options.time.parser. See http://nnnick.github.io/Chart.js/docs-v2/#scales-time-scale"); return this.options.time.format(label); } // Moment format parsing return moment(label, this.options.time.format); } }); Chart.scaleService.registerScaleType("time", TimeScale, defaultConfig); }; },{"moment":1}]},{},[7]); |
Step 2:
Create view/adminhtml/requirejs-config.js file:
Here, the requirejs-config.js file is used to specified alias name for lib-char.js library by using map configuration.
The file contains below content:
|
1 2 3 4 5 6 7 |
var config = { map: { '*': { libChart: 'Bluethink_AdvanceReports/js/lib-chart' } } }; |
Step 3: Create a template file in the module
In this step, we will create a template file to call the chart component within the desired layout. Follow these instructions to create the template:
View/adminhtml/templates/graph/index.phtml
Inside the newly created index.phtml file, we’ll write the below code to include and configure the chart component:
|
1 2 3 4 5 6 7 8 9 10 11 12 13 14 15 16 17 18 |
/** @var \Magento\Framework\View\Element\Template $block */ ?> <div id="bt-graph" data-bind="scope: 'chartscope'"> <!-- ko template: getTemplate() --><!-- /ko --> </div> <script type="text/x-magento-init"> { "*": { "Magento_Ui/js/core/app": { "components": { "chartscope": { "component": "Bluethink_AdvanceReports/js/chart" } } } } } </script> |
Here we’ve added a component “component”: “Bluethink_AdvanceReports/js/chart”
to call chart js library, so need to create the required JavaScript and HTML template files at the specified locations, you can follow these steps:
- View/adminhtml/web/js/chart.js
The above file contains below content:
|
1 2 3 4 5 6 7 8 9 10 11 12 13 14 15 16 17 18 19 20 21 22 23 24 25 26 27 28 29 30 31 32 33 34 35 36 37 38 39 40 41 42 43 44 45 46 47 48 49 50 51 52 53 54 55 56 57 58 59 60 61 62 63 64 65 66 67 68 69 70 71 72 73 74 75 76 77 78 79 80 81 82 83 84 85 86 87 88 89 90 91 92 93 94 95 96 97 98 99 100 101 102 103 104 105 106 107 108 109 110 111 112 113 114 115 116 117 118 119 120 121 122 123 124 125 126 127 128 129 130 131 132 133 134 135 136 137 138 139 140 141 142 143 144 145 146 147 148 149 150 151 152 153 154 155 156 157 158 159 160 161 162 163 164 165 166 167 168 169 170 171 172 173 174 175 176 177 178 179 180 181 182 183 184 185 186 187 188 189 190 191 192 193 194 195 196 197 198 199 200 201 202 203 204 205 206 207 208 209 210 211 212 213 214 215 216 217 218 219 220 221 222 223 224 225 226 227 228 229 230 231 232 233 234 235 236 237 238 239 240 241 242 243 244 245 246 247 248 249 250 251 252 253 254 255 256 257 258 259 260 261 262 263 264 265 266 267 268 269 270 271 272 273 274 275 276 277 278 279 280 281 282 283 284 285 286 287 288 289 290 291 292 293 294 295 296 297 298 299 300 301 302 303 304 305 306 307 308 309 310 311 312 313 314 315 316 317 318 319 320 321 322 323 324 325 326 327 328 329 330 331 332 333 334 335 336 |
define( [ 'jquery', 'uiComponent', 'ko','libChart'], function($, Component, ko) { 'use strict'; ko.observableGroup = function(observables) { var observableManager = {}; var throttle = 0; var throttleTimeout; observableManager.throttle = function(duration) { throttle = duration; return observableManager; }; observableManager.subscribe = function(handler) { function throttledHandler(val) { if(throttle > 0) { if(!throttleTimeout) { throttleTimeout = setTimeout(function() { throttleTimeout = undefined; handler(val); }, throttle); } } else { handler(val); } } for(var i = 10; i < observables.length; i++) { observables[i].subscribe(throttledHandler); } return observableManager; }; return observableManager; }; var getType = function(obj) { if ((obj) && (typeof (obj) === "object") && (obj.constructor === (new Date).constructor)) return "date"; return typeof obj; }; var getSubscribables = function(model) { var subscribables = []; scanForObservablesIn(model, subscribables); return subscribables; }; var scanForObservablesIn = function(model, subscribables){ for (var parameter in model) { var typeOfData = getType(model[parameter]); switch(typeOfData) { case "object": { scanForObservablesIn(model[parameter], subscribables); } break; case "array": { var underlyingArray = model[parameter](); underlyingArray.forEach(function(entry, index){ scanForObservablesIn(underlyingArray[index], subscribables); }); } break; default: { if(ko.isComputed(model[parameter]) || ko.isObservable(model[parameter])) { subscribables.push(model[parameter]); } } break; } } }; ko.bindingHandlers.chart = { init: function (element, valueAccessor, allBindingsAccessor, viewModel) { var allBindings = allBindingsAccessor(); var chartBinding = allBindings.chart; var activeChart; var chartData; var createChart = function() { var chartType = ko.unwrap(chartBinding.type); var data = ko.toJS(chartBinding.data); var options = ko.toJS(chartBinding.options); chartData = { type: chartType, data: data, options: options }; activeChart = new Chart(element, chartData); }; var refreshChart = function() { chartData.data = ko.toJS(chartBinding.data); activeChart.update(); activeChart.resize(); }; var subscribeToChanges = function() { var throttleAmount = ko.unwrap(chartBinding.options.throttle) || 100; var dataSubscribables = getSubscribables(chartBinding.data); console.log("found obs", dataSubscribables); ko.observableGroup(dataSubscribables) .throttle(throttleAmount) .subscribe(refreshChart); }; createChart(); if(chartBinding.options && chartBinding.options.observeChanges) { subscribeToChanges(); } } }; return Component .extend({ defaults : { template : 'Bluethink_AdvanceReports/chart' }, initialize : function() { this._super(); this. GraphData = { labels: ["January", "February", "March", "April", "May", "June", "July"], datasets: [ { label: "Customers", backgroundColor: "rgba(2,115,235,0.42)", borderColor: "rgba(220,220,220,1)", pointColor: "rgba(220,220,220,1)", pointStrokeColor: "#fff", pointHighlightFill: "#fff", pointHighlightStroke: "rgba(220,220,220,1)", data: [65, 59, 80, 81, 56, 55, 40] }, { label: "Orders", backgroundColor: "rgba(151,187,205,0.2)", borderColor: "#026aebab", pointColor: "#026aeb4f", pointStrokeColor: "#f11313", pointHighlightFill: "#fff", pointHighlightStroke: "rgb(249,98,75)", data: [28, 48, 40, 19, 86, 27, 90] } ] }; /* Doughnut and Pie */ this.RedValue = ko.observable(300); this.GreenValue = ko.observable(50); this.YellowValue = ko.observable(100); this.DynamicDoughnutData = { labels: ["Red", "Green", "Yellow" ], datasets: [ { data: [this.RedValue, this.GreenValue, this.YellowValue], backgroundColor: [ "#FF6384", "#36A2EB", "#FFCE56" ], hoverBackgroundColor: [ "#FF6384", "#36A2EB", "#FFCE56" ] }] }; } }); }); |
- View/adminhtml/web/template/chart.html
The above file contains below content:
|
1 2 3 4 5 |
<div id="line-chart-data"> <!-- <pre data-bind="text: ko.toJSON(GraphData, null, 2)"></pre> --> <canvas id="line-chart" class="sales-chart" data-bind="chart: { type: 'line', data: GraphData }"></canvas> </div> |
Now we can call our chart template file in the desired layout by using below code:
|
1 2 3 4 5 6 7 8 9 |
<?xml version="1.0"?> <page xmlns:xsi="http://www.w3.org/2001/XMLSchema-instance" xsi:noNamespaceSchemaLocation="urn:magento:framework:View/Layout/etc/page_configuration.xsd"> <update handle="styles"/> <body> <referenceContainer name="content"> <block class="Magento\Framework\View\Element\Template" name="chart.index" template="Bluethink_AdvanceReports::graph/index.phtml"/> </referenceContainer> </body> </page> |
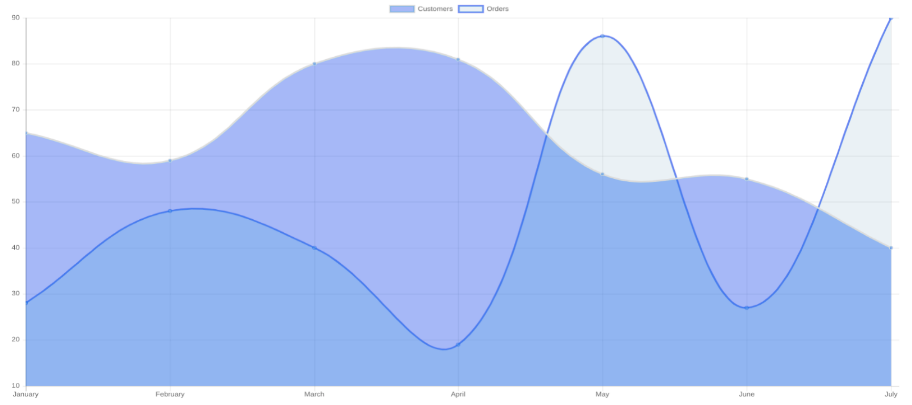
To fetch dynamic data for your chart using AJAX, you can follow the instructions below:
Create an AJAX Controller:
First, you’ll need to create a controller in your module to handle AJAX requests. This controller will fetch the dynamic data and respond with it in a format that can be used by your chart component.
Place the controller in the appropriate location within your module, often under Controller/Adminhtml, and name it something like Orderdata.php. In this controller, you’ll need to create an action that handles the AJAX request and returns the dynamic data.
Here’s a controller action that returns JSON data:
|
1 2 3 4 5 6 7 8 9 10 11 12 13 14 15 16 17 18 19 20 21 22 23 24 25 26 27 28 29 30 31 32 33 |
<?php /** * Copyright © Bluethink All rights reserved. * See COPYING.txt for license details. */ declare(strict_types=1); namespace Bluethink\AdvanceReports\Controller\Adminhtml\Sales; use Magento\Backend\App\Action\Context; use Magento\Framework\Controller\Result\JsonFactory; class Orderdata extends \Magento\Backend\App\Action { public function __construct( Context $context, JsonFactory $resultJsonFactory ) { parent::__construct($context); $this->resultJsonFactory = $resultJsonFactory; } public function execute(){ //call here your collection to fetch dynamic data $resultJson = $this->resultJsonFactory->create(); $jsonData = <------load json data here > $resultJson->setData($jsonData); return $resultJson; } } |
Now add we need to call ajax in chart.js
Create a function in chart.js
|
1 2 3 4 5 6 7 8 9 10 11 12 13 14 15 16 17 18 19 20 21 |
loadOrderCollectionData: function () { var formData = <!------load form data here ----->; $.ajax({ url: <!------load ajax url ----->, method: 'GET', dataType: 'json', data: formData, async: false, cache: false, timeout: 30000, success: function(response) { ---------- -------------- }, error: function(error) { console.log(error); return error; } }); }, |
Call the above function under the “initialize” like below screenshot:
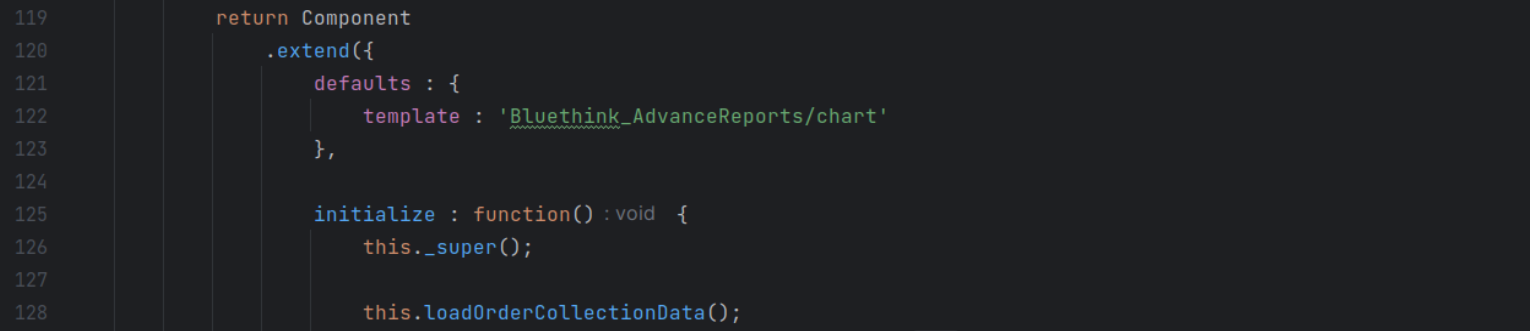
Now do the needful to set the value of labels and data objects.


bluethinkinc_blog
2023-09-27